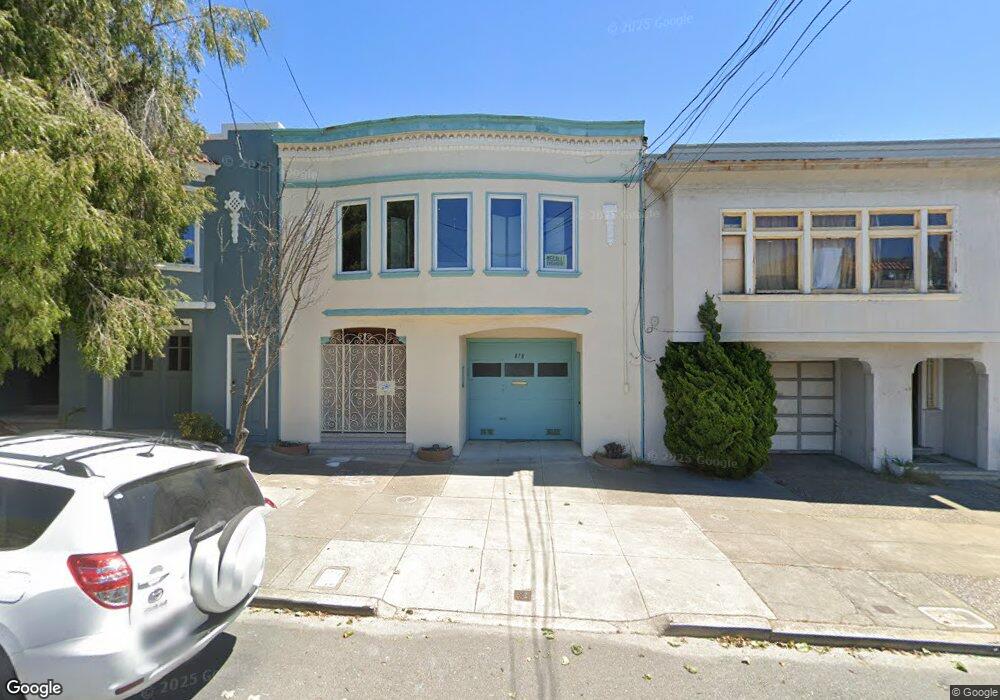
878 40th Ave San Francisco, CA 94121
Outer Richmond NeighborhoodEstimated Value: $1,251,062 - $1,845,000
--
Bed
1
Bath
1,485
Sq Ft
$1,003/Sq Ft
Est. Value
About This Home
This home is located at 878 40th Ave, San Francisco, CA 94121 and is currently estimated at $1,489,516, approximately $1,003 per square foot. 878 40th Ave is a home located in San Francisco County with nearby schools including Lafayette Elementary School, Presidio Middle School, and St. Thomas The Apostle School.
Ownership History
Date
Name
Owned For
Owner Type
Purchase Details
Closed on
Aug 19, 2013
Sold by
Cayabyab Anna Marie
Bought by
Cayabyab Anna M
Current Estimated Value
Purchase Details
Closed on
Dec 20, 1996
Sold by
Marie Cayabyab Anna and Rosales Albert
Bought by
Cayabyab Anna Marie
Purchase Details
Closed on
Nov 19, 1993
Sold by
Cayabyab Albert
Bought by
Cayabyab Anna Marie
Home Financials for this Owner
Home Financials are based on the most recent Mortgage that was taken out on this home.
Original Mortgage
$115,000
Interest Rate
6.74%
Create a Home Valuation Report for This Property
The Home Valuation Report is an in-depth analysis detailing your home's value as well as a comparison with similar homes in the area
Home Values in the Area
Average Home Value in this Area
Purchase History
| Date | Buyer | Sale Price | Title Company |
|---|---|---|---|
| Cayabyab Anna M | -- | None Available | |
| Cayabyab Anna Marie | -- | Commonwealth Title Co | |
| Cayabyab Anna Marie | -- | Fidelity National Title |
Source: Public Records
Mortgage History
| Date | Status | Borrower | Loan Amount |
|---|---|---|---|
| Closed | Cayabyab Anna Marie | $115,000 |
Source: Public Records
Tax History Compared to Growth
Tax History
| Year | Tax Paid | Tax Assessment Tax Assessment Total Assessment is a certain percentage of the fair market value that is determined by local assessors to be the total taxable value of land and additions on the property. | Land | Improvement |
|---|---|---|---|---|
| 2025 | $1,055 | $89,345 | $44,791 | $44,554 |
| 2024 | $1,055 | $87,594 | $43,913 | $43,681 |
| 2023 | $1,040 | $85,877 | $43,052 | $42,825 |
| 2022 | $1,022 | $84,194 | $42,208 | $41,986 |
| 2021 | $1,004 | $82,544 | $41,381 | $41,163 |
| 2020 | $1,006 | $81,698 | $40,957 | $40,741 |
| 2019 | $974 | $80,097 | $40,154 | $39,943 |
| 2018 | $943 | $78,527 | $39,367 | $39,160 |
| 2017 | $931 | $76,989 | $38,596 | $38,393 |
| 2016 | $1,160 | $75,481 | $37,840 | $37,641 |
| 2015 | $1,142 | $74,348 | $37,272 | $37,076 |
| 2014 | $1,112 | $72,892 | $36,542 | $36,350 |
Source: Public Records
Map
Nearby Homes