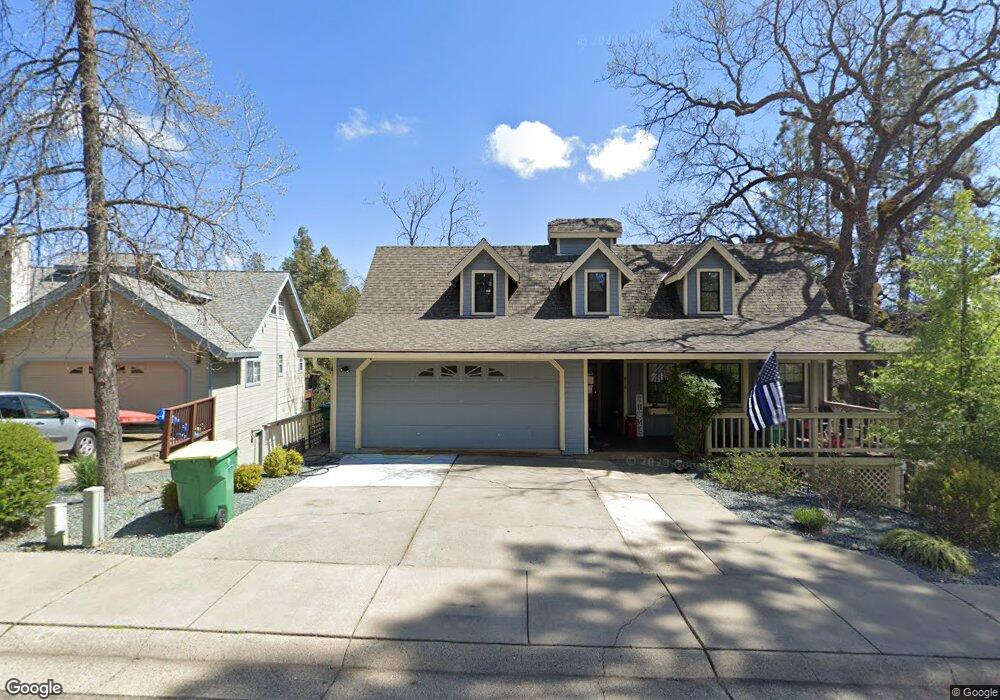
878 Maria Vista Way Placerville, CA 95667
Estimated Value: $310,000 - $497,136
3
Beds
2
Baths
1,572
Sq Ft
$276/Sq Ft
Est. Value
About This Home
This home is located at 878 Maria Vista Way, Placerville, CA 95667 and is currently estimated at $433,784, approximately $275 per square foot. 878 Maria Vista Way is a home located in El Dorado County with nearby schools including El Dorado High School, Country Day Montessori, and El Dorado Adventist School.
Ownership History
Date
Name
Owned For
Owner Type
Purchase Details
Closed on
Feb 9, 2009
Sold by
Quentmeyer Jeff and The Eileen C Clancy Living Tru
Bought by
Dewolf Daniel K and The Daniel K Dewolf Trust
Current Estimated Value
Purchase Details
Closed on
Apr 3, 2007
Sold by
Wyly Ree Ann and The Eileen C Clancy Living Tru
Bought by
Eileen C Clancy Living Trust
Purchase Details
Closed on
May 4, 2006
Sold by
Clancy Eileen C
Bought by
Clancy Eileen C and The Eileen Clancy Living Trust
Purchase Details
Closed on
Jun 23, 1998
Sold by
Nunes Rene M
Bought by
Clancy Eileen C
Purchase Details
Closed on
Jul 25, 1995
Sold by
Nunes Cynthia G
Bought by
Nunes Rene M
Home Financials for this Owner
Home Financials are based on the most recent Mortgage that was taken out on this home.
Original Mortgage
$153,375
Interest Rate
7.62%
Mortgage Type
FHA
Create a Home Valuation Report for This Property
The Home Valuation Report is an in-depth analysis detailing your home's value as well as a comparison with similar homes in the area
Home Values in the Area
Average Home Value in this Area
Purchase History
| Date | Buyer | Sale Price | Title Company |
|---|---|---|---|
| Dewolf Daniel K | $285,000 | Placer Title Company | |
| Eileen C Clancy Living Trust | -- | None Available | |
| Clancy Eileen C | -- | None Available | |
| Clancy Eileen C | $167,000 | Chicago Title Co | |
| Nunes Rene M | -- | Fidelity National Title |
Source: Public Records
Mortgage History
| Date | Status | Borrower | Loan Amount |
|---|---|---|---|
| Previous Owner | Nunes Rene M | $153,375 |
Source: Public Records
Tax History Compared to Growth
Tax History
| Year | Tax Paid | Tax Assessment Tax Assessment Total Assessment is a certain percentage of the fair market value that is determined by local assessors to be the total taxable value of land and additions on the property. | Land | Improvement |
|---|---|---|---|---|
| 2025 | $3,807 | $366,993 | $128,766 | $238,227 |
| 2024 | $3,807 | $359,798 | $126,242 | $233,556 |
| 2023 | $3,763 | $352,744 | $123,767 | $228,977 |
| 2022 | $3,710 | $345,829 | $121,341 | $224,488 |
| 2021 | $3,668 | $339,049 | $118,962 | $220,087 |
| 2020 | $3,613 | $335,574 | $117,743 | $217,831 |
| 2019 | $3,569 | $328,995 | $115,435 | $213,560 |
| 2018 | $3,463 | $322,545 | $113,172 | $209,373 |
| 2017 | $3,411 | $316,221 | $110,953 | $205,268 |
| 2016 | $3,360 | $310,022 | $108,778 | $201,244 |
| 2015 | $3,265 | $305,367 | $107,145 | $198,222 |
| 2014 | $3,208 | $299,388 | $105,048 | $194,340 |
Source: Public Records
Map
Nearby Homes
- 854 Spring St
- 2849 Coloma St
- 881 Conrad Ct
- 2968 Coloma St
- 2830 Coloma St
- 901 Union St
- 837 Vivian Ct
- 3371 Golden Chain Hwy
- 910 Reservoir St
- 636 Canal St
- 645 Myrtle Ave
- 691 Wentworth Ct
- 8325 County Rd M44
- 2816 Holly Ct
- 0 Lincoln Alley
- 2896 Clay St
- 0 Trails End Dr Unit 225117516
- 2-Acres Homestead Dr
- 3 Acres
- 0 Big Cut Rd Unit 225072888
- 872 Maria Vista Way
- 882 Maria Vista Way
- 893 Spring St
- 888 Maria Vista Way
- 868 Maria Vista Way
- 883 Maria Vista Way
- 879 Maria Vista Way
- 873 Maria Vista Way
- 871 Spring St
- 889 Maria Vista Way
- 869 Maria Vista Way
- Acres Spring St
- Acre Spring St
- 0 Spring St Unit 222007556
- 1 Spring St
- 0 Spring St Unit 221011927
- 8066 Spring St
- 0 Spring St
- 892 Maria Vista Way
- 1-Acre Spring St