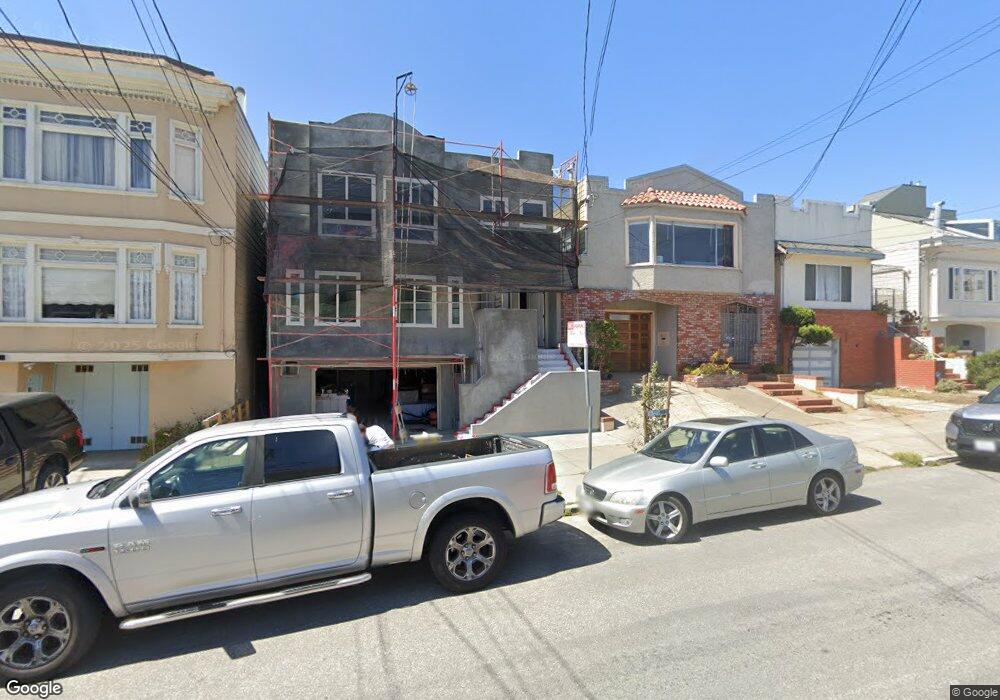
879 39th Ave Unit 881 San Francisco, CA 94121
Outer Richmond NeighborhoodEstimated Value: $1,972,000 - $2,959,541
3
Beds
2
Baths
1,418
Sq Ft
$1,634/Sq Ft
Est. Value
About This Home
This home is located at 879 39th Ave Unit 881, San Francisco, CA 94121 and is currently estimated at $2,316,635, approximately $1,633 per square foot. 879 39th Ave Unit 881 is a home located in San Francisco County with nearby schools including Lafayette Elementary School, Presidio Middle School, and St. Thomas The Apostle School.
Ownership History
Date
Name
Owned For
Owner Type
Purchase Details
Closed on
Jan 22, 2021
Sold by
Vincent Luong and Kim Ong
Bought by
Liu Siyuan John and Liu Caterina Yuan
Current Estimated Value
Home Financials for this Owner
Home Financials are based on the most recent Mortgage that was taken out on this home.
Original Mortgage
$1,812,000
Outstanding Balance
$1,602,356
Interest Rate
2.2%
Mortgage Type
New Conventional
Estimated Equity
$714,279
Purchase Details
Closed on
Sep 12, 2003
Sold by
Luong Vincent and Ong Kim
Bought by
Vincent Luong & Kim Ong Revocable Living
Purchase Details
Closed on
Aug 4, 1997
Sold by
Po Lau Chen and Po Angie Ng
Bought by
Luong Vincent and Ong Kim
Home Financials for this Owner
Home Financials are based on the most recent Mortgage that was taken out on this home.
Original Mortgage
$486,000
Interest Rate
7.61%
Mortgage Type
Commercial
Purchase Details
Closed on
Apr 5, 1994
Sold by
Lau Chen Po and Ng Angie
Bought by
Lau Chen Po and Ng Angie
Home Financials for this Owner
Home Financials are based on the most recent Mortgage that was taken out on this home.
Original Mortgage
$343,000
Interest Rate
5.62%
Mortgage Type
Commercial
Create a Home Valuation Report for This Property
The Home Valuation Report is an in-depth analysis detailing your home's value as well as a comparison with similar homes in the area
Home Values in the Area
Average Home Value in this Area
Purchase History
| Date | Buyer | Sale Price | Title Company |
|---|---|---|---|
| Liu Siyuan John | $2,265,000 | Chicago Title Company | |
| Vincent Luong & Kim Ong Revocable Living | -- | -- | |
| Luong Vincent | $608,000 | North American Title Co | |
| Lau Chen Po | -- | Fidelity National Title Co |
Source: Public Records
Mortgage History
| Date | Status | Borrower | Loan Amount |
|---|---|---|---|
| Open | Liu Siyuan John | $1,812,000 | |
| Previous Owner | Luong Vincent | $486,000 | |
| Previous Owner | Lau Chen Po | $343,000 |
Source: Public Records
Tax History Compared to Growth
Tax History
| Year | Tax Paid | Tax Assessment Tax Assessment Total Assessment is a certain percentage of the fair market value that is determined by local assessors to be the total taxable value of land and additions on the property. | Land | Improvement |
|---|---|---|---|---|
| 2025 | $28,864 | $2,451,702 | $1,716,194 | $735,508 |
| 2024 | $28,864 | $2,403,632 | $1,682,544 | $721,088 |
| 2023 | $28,436 | $2,356,504 | $1,649,554 | $706,950 |
| 2022 | $27,905 | $2,310,300 | $1,617,210 | $693,090 |
| 2021 | $11,319 | $896,885 | $442,543 | $454,342 |
| 2020 | $11,379 | $887,690 | $438,006 | $449,684 |
| 2019 | $10,991 | $870,285 | $429,418 | $440,867 |
| 2018 | $10,621 | $853,222 | $420,999 | $432,223 |
| 2017 | $10,198 | $836,494 | $412,745 | $423,749 |
| 2016 | $10,023 | $820,093 | $404,652 | $415,441 |
| 2015 | $9,898 | $807,775 | $398,574 | $409,201 |
| 2014 | $9,638 | $791,953 | $390,767 | $401,186 |
Source: Public Records
Map
Nearby Homes