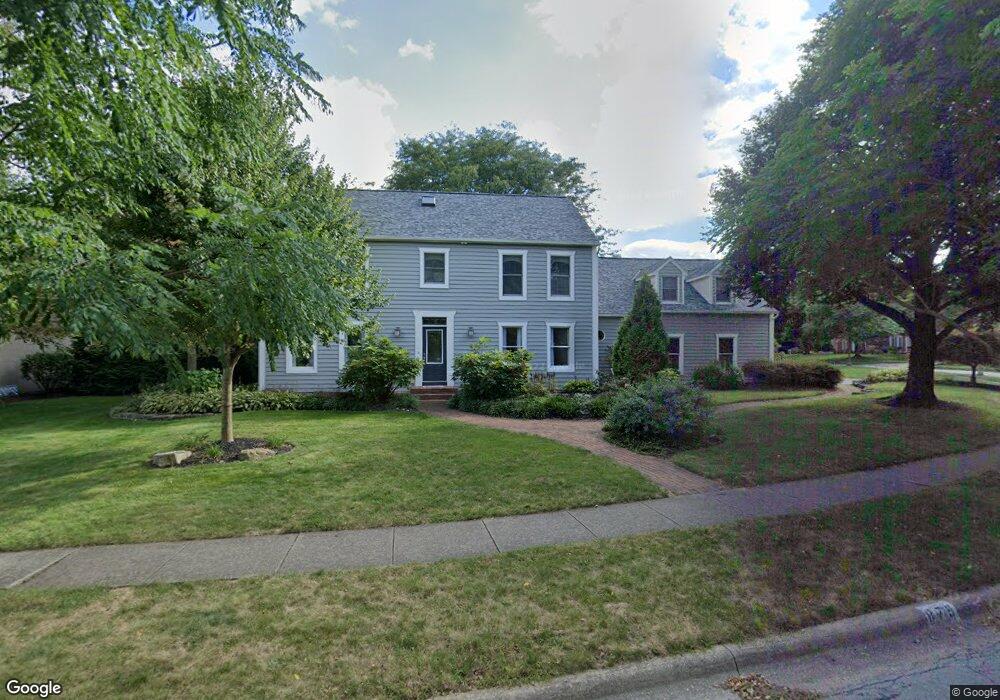
879 Cherryfield Ave Columbus, OH 43235
Estimated Value: $558,000 - $683,376
4
Beds
4
Baths
2,862
Sq Ft
$225/Sq Ft
Est. Value
About This Home
This home is located at 879 Cherryfield Ave, Columbus, OH 43235 and is currently estimated at $643,344, approximately $224 per square foot. 879 Cherryfield Ave is a home located in Franklin County with nearby schools including Worthington Hills Elementary School, McCord Middle School, and Worthington Kilbourne High School.
Ownership History
Date
Name
Owned For
Owner Type
Purchase Details
Closed on
Sep 1, 2016
Sold by
Tobbe Robert W and Tobbe Susan C
Bought by
Kuzio Michelle T and Kuzio Family Presevation Truis
Current Estimated Value
Purchase Details
Closed on
Aug 3, 2016
Sold by
Tobbe Robert W and Tobbe Susan C
Bought by
Kuzio Michelle T and Kuzio Family Presevation Truis
Purchase Details
Closed on
Aug 12, 1992
Bought by
Tobbe Robert W and Tobbe Susan C
Purchase Details
Closed on
Jul 1, 1986
Purchase Details
Closed on
Jun 1, 1984
Create a Home Valuation Report for This Property
The Home Valuation Report is an in-depth analysis detailing your home's value as well as a comparison with similar homes in the area
Home Values in the Area
Average Home Value in this Area
Purchase History
| Date | Buyer | Sale Price | Title Company |
|---|---|---|---|
| Kuzio Michelle T | -- | None Available | |
| Kuzio Michelle T | -- | None Available | |
| Tobbe Robert W | $285,000 | -- | |
| -- | $241,000 | -- | |
| -- | $36,000 | -- |
Source: Public Records
Tax History
| Year | Tax Paid | Tax Assessment Tax Assessment Total Assessment is a certain percentage of the fair market value that is determined by local assessors to be the total taxable value of land and additions on the property. | Land | Improvement |
|---|---|---|---|---|
| 2025 | $12,212 | $208,710 | $58,000 | $150,710 |
| 2024 | $12,212 | $208,710 | $58,000 | $150,710 |
| 2023 | $11,715 | $208,705 | $57,995 | $150,710 |
| 2022 | $10,277 | $147,640 | $33,220 | $114,420 |
| 2021 | $9,481 | $147,640 | $33,220 | $114,420 |
| 2020 | $9,132 | $147,640 | $33,220 | $114,420 |
| 2019 | $8,325 | $123,000 | $27,690 | $95,310 |
| 2018 | $8,466 | $123,000 | $27,690 | $95,310 |
| 2017 | $8,163 | $123,000 | $27,690 | $95,310 |
| 2016 | $8,867 | $133,640 | $29,020 | $104,620 |
| 2015 | $8,868 | $133,640 | $29,020 | $104,620 |
| 2014 | $8,865 | $133,640 | $29,020 | $104,620 |
| 2013 | $4,142 | $126,035 | $26,390 | $99,645 |
Source: Public Records
Map
Nearby Homes
- 877 Northbridge Ln
- 809 Colony Ct
- 742 Gatehouse Ln
- 909 Clubview Blvd N
- 908 Clubview Blvd N
- 902-904 Bluffway Dr
- 1041 Bluffway Dr
- 1289 Clubview Blvd S
- 820 Old Woods Rd
- 1159 Tessier Dr
- 0 Edgecliff Dr Unit 226005827
- 1448 Clubview Blvd N
- 7044 Linworth Rd
- 1539 Clubview Blvd S
- 1576 Fallhaven Dr
- 8240 Spruce Needle Ct
- 1729 Laredo Ct
- 1502 Markland St
- 7682 Traphill Ct
- 1483 Dogwood Loop
- 893 Cherryfield Ave
- 867 Cherryfield Ave
- 7681 Whitewood Ct
- 880 Cherryfield Ave
- 880 Pipestone Dr
- 868 Cherryfield Ave
- 901 Cherryfield Ave
- 896 Cherryfield Ave
- 856 Cherryfield Ave
- 912 Cherryfield Ave
- 839 Cherryfield Ave
- 884 Pipestone Dr
- 7669 Whitewood Ct
- 844 Cherryfield Ave
- 909 Cherryfield Ave
- 865 Pipestone Dr
- 7682 Whitewood Ct
- 853 Pipestone Dr
- 878 Pipestone Dr
- 845 Pipestone Dr
Your Personal Tour Guide
Ask me questions while you tour the home.