
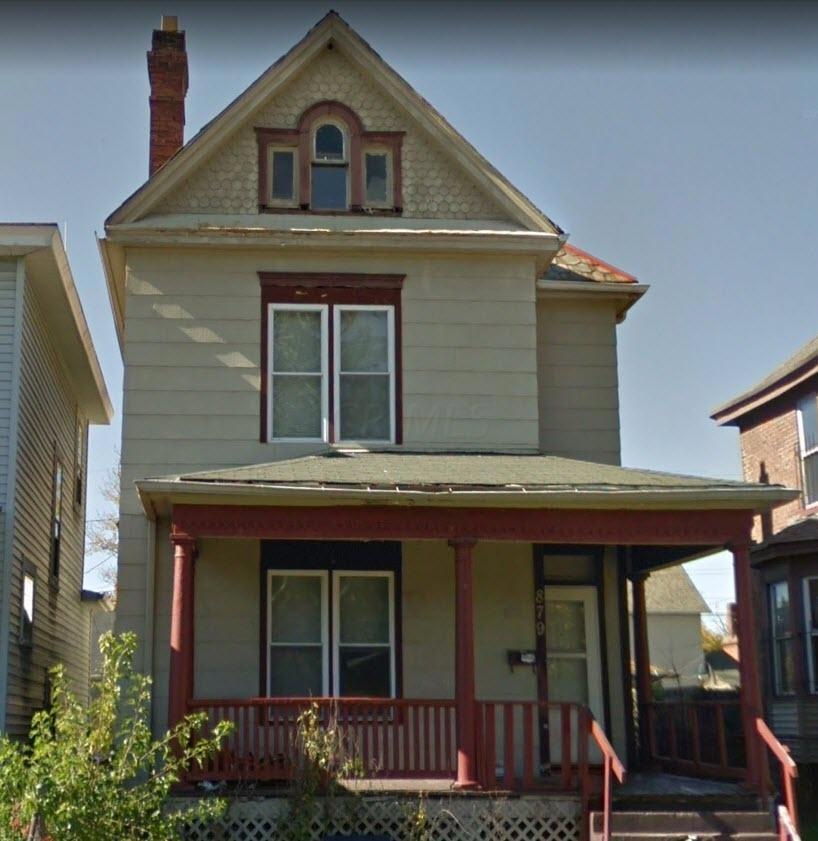

879 Linwood Ave Columbus, OH 43206
Southern Orchards Neighborhood
3
Beds
1
Bath
1,552
Sq Ft
4,356
Sq Ft Lot
Highlights
- Deck
- 2 Car Garage
- Wood Siding
- Central Air
- Family Room
- Carpet
About This Home
As of May 2024MULTIPLE OFFERS RECEIVED! Highest and best by 10/11/2017 12:00 PM EST
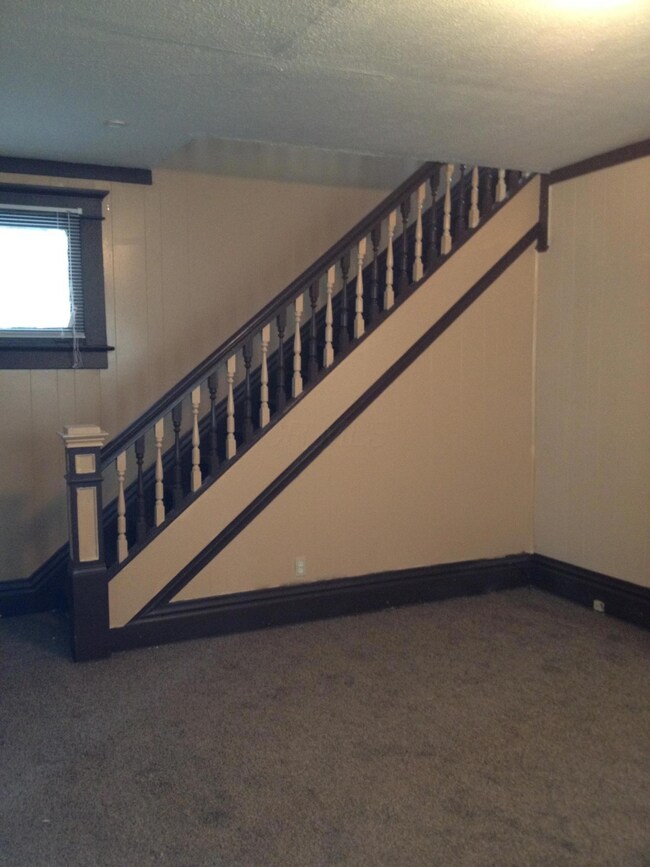
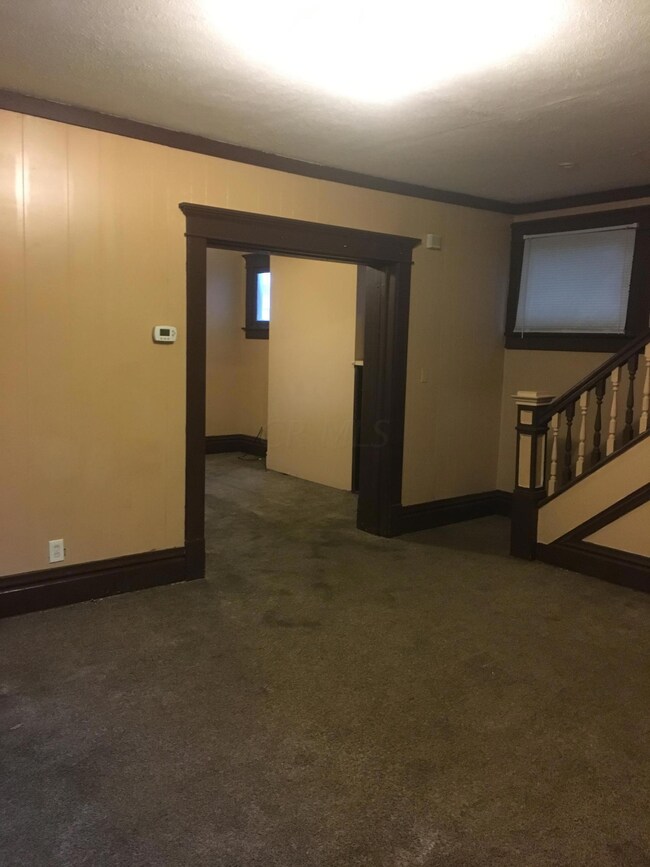
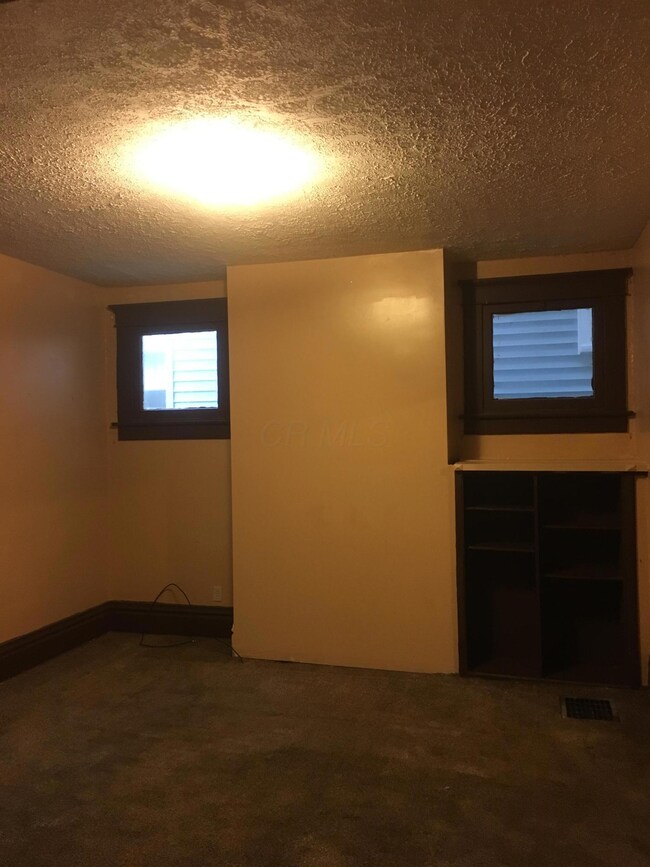
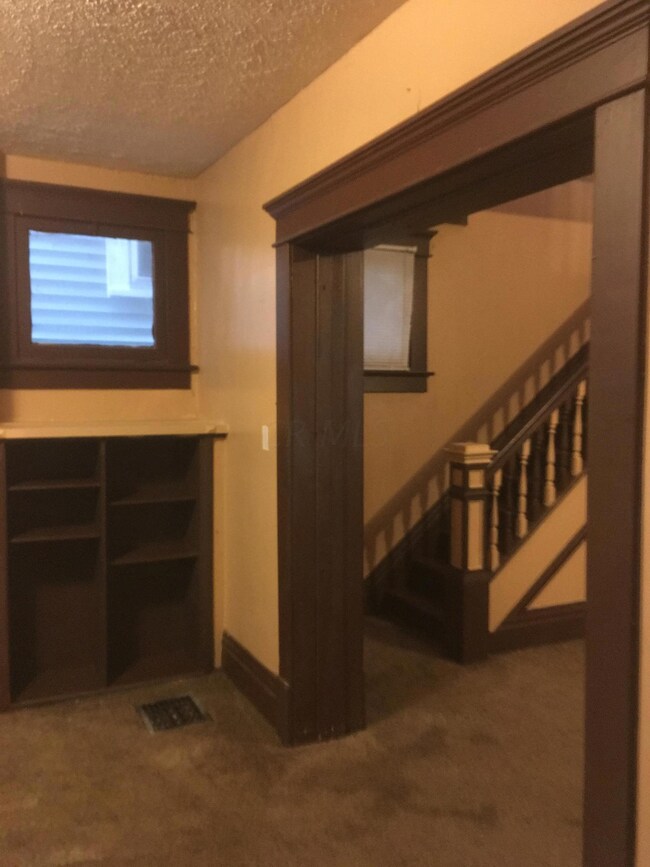
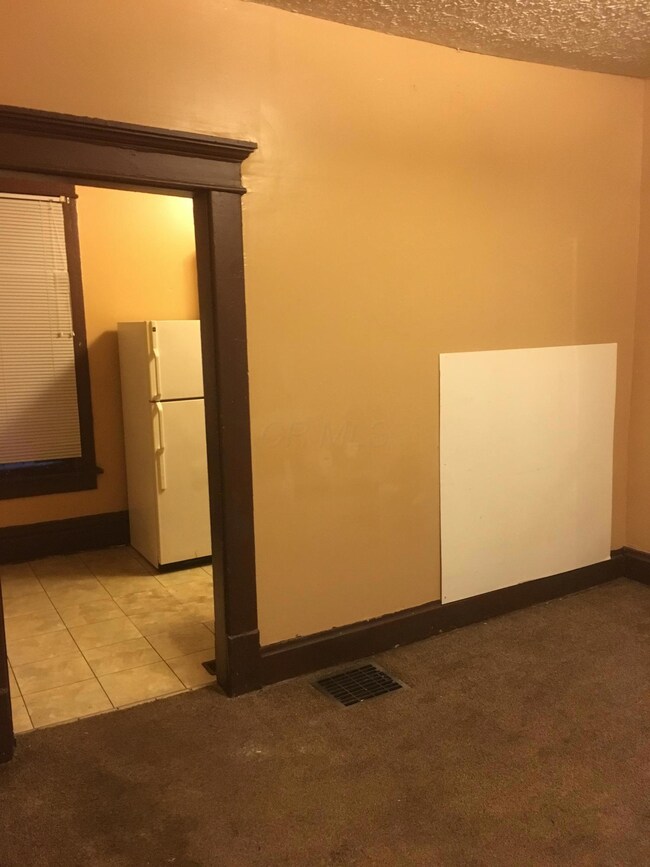
Great opportunity to own in and near one of the fastest appreciating areas in Columbus. This home offers 3 bedrooms, 1 full bathroom, huge living room, dining room and family rooms, high ceilings. Rooms are carpeted. House located in the established Southern Orchards neighborhood. Spacious 2 car garage. Great opportunity to make the necessary updates at a great value for the investor or home-owner.
Property is being sold in AS-IS condition and priced accordingly
Last Agent to Sell the Property
Yanina Kalyanova
Cap Rate Realty Listed on: 10/09/2017
Home Details
Home Type
- Single Family
Est. Annual Taxes
- $309
Year Built
- Built in 1900
Parking
- 2 Car Garage
Home Design
- Stone Foundation
- Wood Siding
Interior Spaces
- 1,552 Sq Ft Home
- 2.5-Story Property
- Family Room
- Carpet
- Basement
Kitchen
- Electric Range
- Microwave
Bedrooms and Bathrooms
- 3 Bedrooms
- 1 Full Bathroom
Utilities
- Central Air
- Heating System Uses Gas
Additional Features
- Deck
- 4,356 Sq Ft Lot
Listing and Financial Details
- Assessor Parcel Number 010-037348
Ownership History
Date
Name
Owned For
Owner Type
Purchase Details
Listed on
Oct 21, 2023
Closed on
Apr 29, 2024
Sold by
Mcnew Shannon L
Bought by
Boss Joshua and Stenson Alyssa
Seller's Agent
Shannon McNew
MDC Realty Limited
Buyer's Agent
Carlton Churchill
Rich Russo Realty & Co.
List Price
$334,500
Sold Price
$305,000
Premium/Discount to List
-$29,500
-8.82%
Total Days on Market
3
Views
314
Current Estimated Value
Home Financials for this Owner
Home Financials are based on the most recent Mortgage that was taken out on this home.
Estimated Appreciation
$7,802
Avg. Annual Appreciation
2.46%
Original Mortgage
$294,325
Outstanding Balance
$291,496
Interest Rate
6.82%
Mortgage Type
FHA
Estimated Equity
$21,306
Purchase Details
Closed on
Jan 24, 2020
Sold by
Mcnew Gloria and Mcnew Thomas
Bought by
Mcnew Shannon L
Home Financials for this Owner
Home Financials are based on the most recent Mortgage that was taken out on this home.
Original Mortgage
$193,000
Interest Rate
3.6%
Mortgage Type
New Conventional
Purchase Details
Listed on
Dec 27, 2018
Closed on
Apr 1, 2019
Sold by
Ross Calvin
Bought by
Mcnew Shannon L and Mcnew Gloria
Seller's Agent
Misty Linn
Core Ohio, Inc.
Buyer's Agent
Shannon McNew
MDC Realty Limited
List Price
$199,000
Sold Price
$190,000
Premium/Discount to List
-$9,000
-4.52%
Home Financials for this Owner
Home Financials are based on the most recent Mortgage that was taken out on this home.
Avg. Annual Appreciation
8.40%
Original Mortgage
$186,558
Interest Rate
4.4%
Mortgage Type
FHA
Purchase Details
Listed on
Oct 9, 2017
Closed on
Oct 18, 2017
Sold by
Kalyanova Yana
Bought by
Ammu 401K Trust Llc
Seller's Agent
Yanina Kalyanova
Cap Rate Realty
Buyer's Agent
Damon Massey
Berkshire Hathaway HS Pro Rlty
List Price
$68,750
Sold Price
$62,000
Premium/Discount to List
-$6,750
-9.82%
Home Financials for this Owner
Home Financials are based on the most recent Mortgage that was taken out on this home.
Avg. Annual Appreciation
117.65%
Purchase Details
Closed on
Jun 18, 2014
Sold by
1St Home Deals Llc
Bought by
Kalyanova Yana
Purchase Details
Closed on
Oct 26, 2012
Sold by
Borovskikh Vladimir
Bought by
1St Home Deals Llc
Purchase Details
Listed on
May 22, 2012
Closed on
Jun 15, 2012
Sold by
Fannie Mae
Bought by
Borovskikh Vladimir
Seller's Agent
John Parmi
RE/MAX Affiliates, Inc.
Buyer's Agent
Antonio D'Alberto
Exit Trinity Realty
List Price
$12,500
Sold Price
$11,000
Premium/Discount to List
-$1,500
-12%
Home Financials for this Owner
Home Financials are based on the most recent Mortgage that was taken out on this home.
Avg. Annual Appreciation
29.55%
Purchase Details
Closed on
Dec 18, 2008
Sold by
Butler Monica
Bought by
Dmb Ventures Ltd
Home Financials for this Owner
Home Financials are based on the most recent Mortgage that was taken out on this home.
Original Mortgage
$63,750
Interest Rate
6.09%
Mortgage Type
Unknown
Purchase Details
Closed on
Sep 3, 2008
Sold by
Edward Thomas Investment Group Llc
Bought by
Butler Monica
Home Financials for this Owner
Home Financials are based on the most recent Mortgage that was taken out on this home.
Original Mortgage
$63,750
Interest Rate
6.09%
Mortgage Type
Unknown
Purchase Details
Closed on
Jul 21, 2008
Sold by
Us Bank Na
Bought by
Edward Thomas Investment Group Llc
Home Financials for this Owner
Home Financials are based on the most recent Mortgage that was taken out on this home.
Original Mortgage
$65,000
Interest Rate
6.54%
Mortgage Type
Seller Take Back
Purchase Details
Closed on
Jun 25, 2008
Sold by
Foster Frances Mae and Mortgage Electronic Registrati
Bought by
Wachovia Bank Na and Aegis Asset Backed Securities Trust 2004
Home Financials for this Owner
Home Financials are based on the most recent Mortgage that was taken out on this home.
Original Mortgage
$37,515
Interest Rate
6.66%
Mortgage Type
Balloon
Purchase Details
Closed on
Nov 15, 2004
Sold by
Williams Perry Jr William and Williams Perry Teresa
Bought by
Foster Frances and Foster Faith
Home Financials for this Owner
Home Financials are based on the most recent Mortgage that was taken out on this home.
Original Mortgage
$83,700
Interest Rate
6.35%
Mortgage Type
Purchase Money Mortgage
Purchase Details
Closed on
May 29, 2001
Sold by
Mulenga Gyekye Mulenga and Mulenga M
Bought by
Williams Perry Jr William and Williams Perry Teresa
Home Financials for this Owner
Home Financials are based on the most recent Mortgage that was taken out on this home.
Original Mortgage
$57,200
Interest Rate
11.85%
Purchase Details
Closed on
Mar 3, 1980
Bought by
Gyekye Mulenga
Similar Homes in Columbus, OH
Create a Home Valuation Report for This Property
The Home Valuation Report is an in-depth analysis detailing your home's value as well as a comparison with similar homes in the area
Home Values in the Area
Average Home Value in this Area
Purchase History
| Date | Type | Sale Price | Title Company |
|---|---|---|---|
| Warranty Deed | $305,000 | None Listed On Document | |
| Interfamily Deed Transfer | -- | First Source Title | |
| Deed | $190,000 | Pm Title Box | |
| Warranty Deed | $62,000 | Pm Title Llc | |
| Warranty Deed | $13,000 | Stewart Title Agency | |
| Quit Claim Deed | -- | None Available | |
| Limited Warranty Deed | $5,500 | None Available | |
| Warranty Deed | -- | Attorney | |
| Warranty Deed | $65,000 | None Available | |
| Limited Warranty Deed | $11,300 | Title Ques | |
| Sheriffs Deed | $52,000 | None Available | |
| Warranty Deed | $93,000 | Americas C | |
| Survivorship Deed | $71,500 | Superior Land Title | |
| Deed | $16,200 | -- |
Source: Public Records
Mortgage History
| Date | Status | Loan Amount | Loan Type |
|---|---|---|---|
| Open | $294,325 | FHA | |
| Previous Owner | $193,000 | New Conventional | |
| Previous Owner | $186,558 | FHA | |
| Previous Owner | $63,750 | Unknown | |
| Previous Owner | $65,000 | Seller Take Back | |
| Previous Owner | $37,515 | Balloon | |
| Previous Owner | $83,700 | Purchase Money Mortgage | |
| Previous Owner | $65,100 | Unknown | |
| Previous Owner | $57,200 | No Value Available |
Source: Public Records
Property History
| Date | Event | Price | Change | Sq Ft Price |
|---|---|---|---|---|
| 03/31/2025 03/31/25 | Off Market | $62,000 | -- | -- |
| 03/28/2025 03/28/25 | Off Market | $305,000 | -- | -- |
| 03/27/2025 03/27/25 | Off Market | $11,000 | -- | -- |
| 03/27/2025 03/27/25 | Off Market | $62,000 | -- | -- |
| 05/16/2024 05/16/24 | Sold | $305,000 | 0.0% | $159 / Sq Ft |
| 03/19/2024 03/19/24 | Price Changed | $305,000 | -1.5% | $159 / Sq Ft |
| 02/29/2024 02/29/24 | Price Changed | $309,500 | -1.0% | $161 / Sq Ft |
| 01/14/2024 01/14/24 | Price Changed | $312,500 | -0.6% | $162 / Sq Ft |
| 12/21/2023 12/21/23 | Price Changed | $314,500 | -1.6% | $163 / Sq Ft |
| 11/17/2023 11/17/23 | Price Changed | $319,500 | -1.5% | $166 / Sq Ft |
| 11/05/2023 11/05/23 | Price Changed | $324,500 | -1.5% | $169 / Sq Ft |
| 10/31/2023 10/31/23 | Price Changed | $329,500 | -1.5% | $171 / Sq Ft |
| 10/21/2023 10/21/23 | For Sale | $334,500 | +76.1% | $174 / Sq Ft |
| 03/29/2019 03/29/19 | Sold | $190,000 | -4.5% | $103 / Sq Ft |
| 01/13/2019 01/13/19 | Pending | -- | -- | -- |
| 12/27/2018 12/27/18 | For Sale | $199,000 | +221.0% | $107 / Sq Ft |
| 10/18/2017 10/18/17 | Sold | $62,000 | -9.8% | $40 / Sq Ft |
| 10/08/2017 10/08/17 | For Sale | $68,750 | +525.0% | $44 / Sq Ft |
| 06/27/2012 06/27/12 | Sold | $11,000 | -12.0% | $7 / Sq Ft |
| 05/28/2012 05/28/12 | Pending | -- | -- | -- |
| 05/22/2012 05/22/12 | For Sale | $12,500 | -- | $8 / Sq Ft |
Source: Columbus and Central Ohio Regional MLS
Tax History Compared to Growth
Tax History
| Year | Tax Paid | Tax Assessment Tax Assessment Total Assessment is a certain percentage of the fair market value that is determined by local assessors to be the total taxable value of land and additions on the property. | Land | Improvement |
|---|---|---|---|---|
| 2024 | $3,192 | $71,130 | $27,970 | $43,160 |
| 2023 | $3,152 | $71,120 | $27,965 | $43,155 |
| 2022 | $1,698 | $32,730 | $5,040 | $27,690 |
| 2021 | $1,829 | $32,730 | $5,040 | $27,690 |
| 2020 | $1,867 | $32,730 | $5,040 | $27,690 |
| 2019 | $1,317 | $21,180 | $3,890 | $17,290 |
| 2018 | $1,040 | $21,180 | $3,890 | $17,290 |
| 2017 | $694 | $17,370 | $3,890 | $13,480 |
| 2016 | $309 | $4,550 | $3,430 | $1,120 |
| 2015 | $502 | $4,550 | $3,430 | $1,120 |
| 2014 | $1,070 | $17,260 | $3,430 | $13,830 |
| 2013 | $556 | $18,165 | $3,605 | $14,560 |
Source: Public Records
Agents Affiliated with this Home
-
Shannon McNew
Seller's Agent in 2024
Shannon McNew
MDC Realty Limited
(419) 210-4115
1 in this area
19 Total Sales
-
Carlton Churchill
Buyer's Agent in 2024
Carlton Churchill
Rich Russo Realty & Co.
(614) 208-0642
2 in this area
212 Total Sales
-
M
Seller's Agent in 2019
Misty Linn
Core Ohio, Inc.
-
Y
Seller's Agent in 2017
Yanina Kalyanova
Cap Rate Realty
-
Damon Massey
Buyer's Agent in 2017
Damon Massey
Berkshire Hathaway HS Pro Rlty
(614) 626-7727
4 Total Sales
-
John Parmi
Seller's Agent in 2012
John Parmi
RE/MAX
(614) 206-2743
64 Total Sales
Map
Source: Columbus and Central Ohio Regional MLS
MLS Number: 217036919
APN: 010-037348
Disclaimer: Certain information contained herein is derived from information provided by parties other than Homes.com. All information provided is deemed reliable, but is not guaranteed to be accurate and should be independently verified.
![]() IDX information is provided exclusively for personal, non-commercial use, and may not be used for any purpose other than to identify prospective properties consumers may be interested in purchasing.
IDX information is provided exclusively for personal, non-commercial use, and may not be used for any purpose other than to identify prospective properties consumers may be interested in purchasing.
Information is deemed reliable but not guaranteed.
Nearby Homes
- 1150 E Sycamore St
- 838 Wilson Ave
- 889 Studer Ave
- 938 Linwood Ave
- 1250 E Sycamore St
- 870 Oakwood Ave
- 917 Lockbourne Rd
- 810 Oakwood Ave
- 909 Oakwood Ave
- 901 Miller Ave
- 925 Miller Ave
- 976 Oakwood Ave
- 716 Wilson Ave
- 966 Miller Ave
- 1021 E Livingston Ave
- 1060-1062 Linwood Ave
- 1038 Lockbourne Rd
- 856 S Ohio Ave
- 1107 Stanley Ave
- 947 S Champion Ave