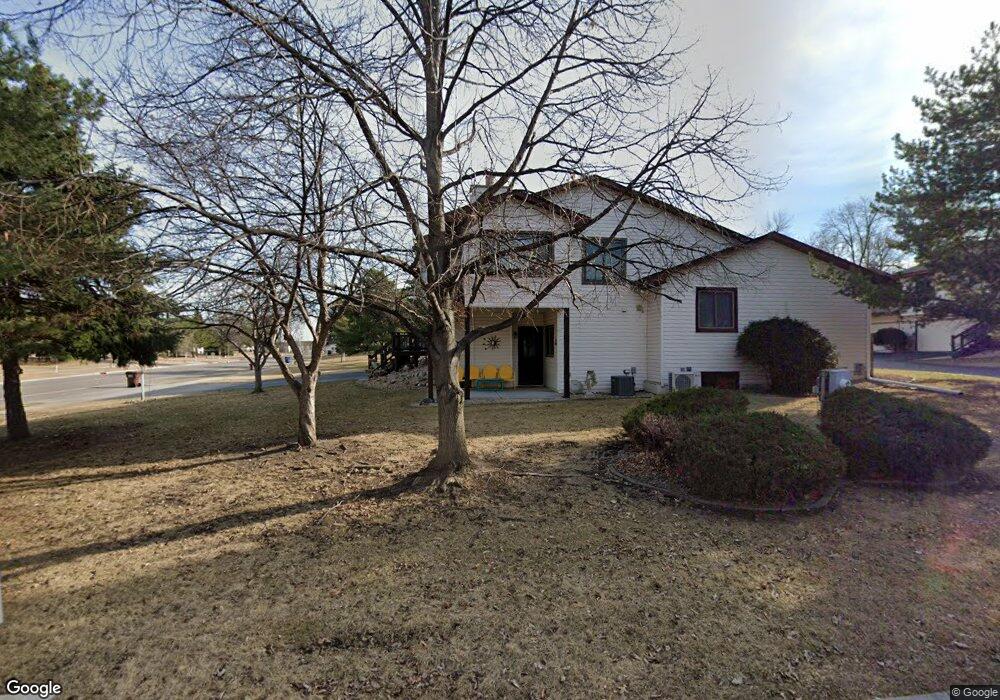
8791 Forestview Ln N Maple Grove, MN 55369
Estimated Value: $290,959 - $510,000
3
Beds
2
Baths
1,132
Sq Ft
$312/Sq Ft
Est. Value
About This Home
This home is located at 8791 Forestview Ln N, Maple Grove, MN 55369 and is currently estimated at $352,990, approximately $311 per square foot. 8791 Forestview Ln N is a home located in Hennepin County with nearby schools including Rice Lake Elementary School, Maple Grove Middle School, and Maple Grove Senior High School.
Ownership History
Date
Name
Owned For
Owner Type
Purchase Details
Closed on
Sep 27, 2018
Sold by
Rehschuh Paul W
Bought by
Singer Francis J and Singer Nancy E
Current Estimated Value
Home Financials for this Owner
Home Financials are based on the most recent Mortgage that was taken out on this home.
Original Mortgage
$171,600
Outstanding Balance
$106,580
Interest Rate
4.5%
Mortgage Type
New Conventional
Estimated Equity
$246,410
Purchase Details
Closed on
Jul 15, 2013
Sold by
Alexander Roy and Alexander Lynda R
Bought by
Rehschuj Paul W
Home Financials for this Owner
Home Financials are based on the most recent Mortgage that was taken out on this home.
Original Mortgage
$114,000
Interest Rate
4.02%
Mortgage Type
New Conventional
Purchase Details
Closed on
Nov 22, 2002
Sold by
Nelson Lars J and Kettner Elaine Smith
Bought by
Rehschuh Lynda R
Purchase Details
Closed on
May 24, 2001
Sold by
Berg Gerald D and Berg Linda A
Bought by
Smith Elaine S and Nelson Lars J
Create a Home Valuation Report for This Property
The Home Valuation Report is an in-depth analysis detailing your home's value as well as a comparison with similar homes in the area
Home Values in the Area
Average Home Value in this Area
Purchase History
| Date | Buyer | Sale Price | Title Company |
|---|---|---|---|
| Singer Francis J | $214,500 | Modern Title Llc | |
| Rehschuj Paul W | $142,500 | Title Support Services | |
| Rehschuh Lynda R | $178,900 | -- | |
| Smith Elaine S | $169,900 | -- |
Source: Public Records
Mortgage History
| Date | Status | Borrower | Loan Amount |
|---|---|---|---|
| Open | Singer Francis J | $171,600 | |
| Previous Owner | Rehschuj Paul W | $114,000 |
Source: Public Records
Tax History
| Year | Tax Paid | Tax Assessment Tax Assessment Total Assessment is a certain percentage of the fair market value that is determined by local assessors to be the total taxable value of land and additions on the property. | Land | Improvement |
|---|---|---|---|---|
| 2024 | $3,929 | $312,100 | $62,900 | $249,200 |
| 2023 | $3,759 | $302,200 | $63,800 | $238,400 |
| 2022 | $2,993 | $298,600 | $47,300 | $251,300 |
| 2021 | $2,527 | $234,500 | $25,300 | $209,200 |
| 2020 | $2,697 | $217,800 | $19,900 | $197,900 |
| 2019 | $2,244 | $221,400 | $38,300 | $183,100 |
| 2018 | $2,192 | $179,800 | $17,800 | $162,000 |
| 2017 | $2,163 | $165,900 | $31,000 | $134,900 |
| 2016 | $2,030 | $155,500 | $33,000 | $122,500 |
| 2015 | $2,047 | $152,900 | $35,000 | $117,900 |
| 2014 | -- | $133,900 | $35,000 | $98,900 |
Source: Public Records
Map
Nearby Homes
- 11781 88th Ave N
- 8701 Goldenrod Ln N
- 8864 Cottonwood Ln N
- 12029 86th Ave N
- 12137 88th Place N
- 11899 85th Place N
- 8517 Forestview Ln N
- 12156 85th Place N
- 8936 Norwood Ln N
- 8451 Jonquil Ln N
- 11668 84th Ave N Unit 303
- 8414 Hemlock Ln N
- 8410 Jonquil Ln N
- 8406 Jonquil Ln N
- 8402 Jonquil Ln N
- 8599 Oakview Way N
- 12443 90th Ave N
- 8358 Hemlock Ln N
- 8411 Larch Ln N
- 12635 91st Ave N
- 11727 88th Ave N
- 8785 Forestview Ln N
- 11731 88th Ave N
- 11731 11731 88th-Avenue-n
- 11761 88th Ave N
- 11761 11761 88th-Avenue-n
- 11765 88th Ave N
- 11777 88th Ave N
- 8821 Forestview Ln N
- 11750 88th Ave N
- 11766 88th Ave N
- 11791 88th Ave N
- 11730 88th Ave N
- 8825 Forestview Ln N
- 8820 Forestview Ln N
- 11754 88th Ave N
- 8755 Forestview Ln N
- 8758 Forestview Ln N
- 11780 88th Ave N
- 11780 11780 88th-Avenue-n
Your Personal Tour Guide
Ask me questions while you tour the home.