88 Clover Dale Rd S Dunlap, TN 37327
Estimated payment $1,534/month
Highlights
- Open Floorplan
- Wood Flooring
- No HOA
- Deck
- Bonus Room
- Covered Patio or Porch
About This Home
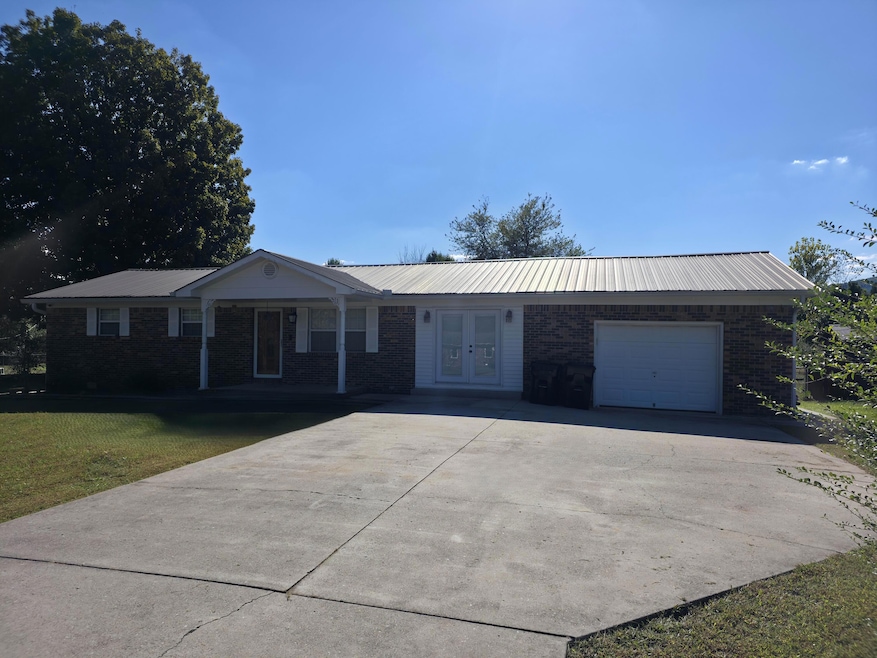
Charming Brick Home in a Peaceful Neighborhood
Welcome to this delightful one-level brick home, nestled in a quiet and friendly neighborhood. Featuring a spacious flat yard and a fully fenced backyard—perfect for pets, play, or gardening—this property offers both comfort and convenience. Enjoy relaxing evenings on the covered back porch, ideal for outdoor dining or unwinding with a good book.
The home includes a concrete driveway leading to a cozy garage, providing secure parking and extra storage. With its classic curb appeal and practical layout, this quaint residence is a wonderful opportunity for first-time buyers, downsizers, or anyone seeking a low-maintenance lifestyle. more pictures coming soon
Listing Agent
Heartland Realty & Auction, In License #360744 Listed on: 10/27/2025
Home Details
Home Type
- Single Family
Est. Annual Taxes
- $1,365
Year Built
- Built in 1978
Lot Details
- 0.37 Acre Lot
- Lot Dimensions are 100x160
- Property fronts a county road
- Fenced
- Rectangular Lot
- Cleared Lot
- Back Yard
Parking
- 2 Car Attached Garage
- Parking Available
- Driveway
Home Design
- Brick Exterior Construction
- Brick Foundation
- Stone Foundation
- Metal Roof
- Stone
Interior Spaces
- 1,325 Sq Ft Home
- 1-Story Property
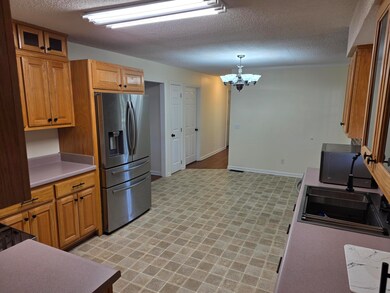
- Open Floorplan
- Wired For Data
- Living Room
- Bonus Room
- Basement
- Crawl Space
- Fire and Smoke Detector
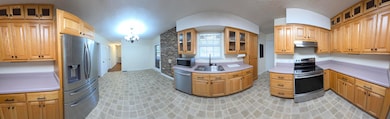
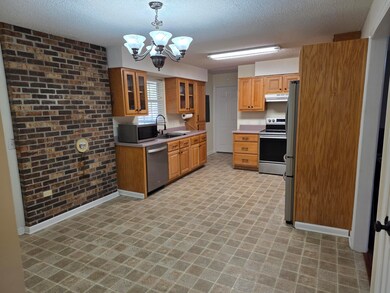
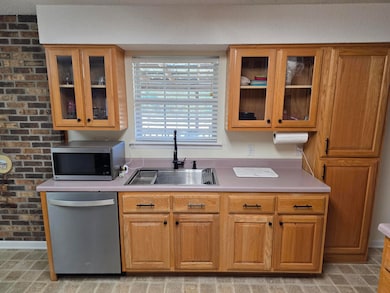
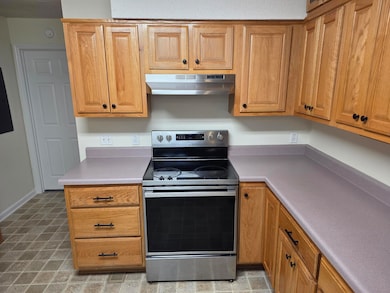
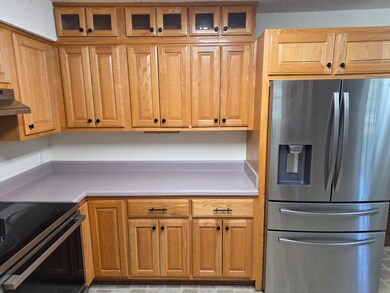
Kitchen
- Free-Standing Electric Range
- Range Hood
- Dishwasher
Flooring
- Wood
- Carpet
- Linoleum
Bedrooms and Bathrooms
- 3 Bedrooms
- Bathtub with Shower
Laundry
- Laundry Room
- Laundry on main level
- Washer and Electric Dryer Hookup
Outdoor Features
- Deck
- Covered Patio or Porch
- Rain Gutters
Schools
- Griffith Elementary School
- Sequatchie Middle School
- Sequatchie High School
Utilities
- Central Heating and Cooling System
- Heating System Uses Natural Gas
- Electric Water Heater
- Septic Tank
- Phone Available
- Cable TV Available
Listing and Financial Details
- Assessor Parcel Number 054 004.27
Community Details
Overview
- No Home Owners Association
- Cloverdale Subdivision
Amenities
- Laundry Facilities
Map
Home Values in the Area
Average Home Value in this Area
Tax History
| Year | Tax Paid | Tax Assessment Tax Assessment Total Assessment is a certain percentage of the fair market value that is determined by local assessors to be the total taxable value of land and additions on the property. | Land | Improvement |
|---|---|---|---|---|
| 2024 | $1,366 | $56,550 | $4,625 | $51,925 |
| 2023 | $1,366 | $56,550 | $4,625 | $51,925 |
| 2022 | $732 | $22,075 | $2,225 | $19,850 |
| 2021 | $721 | $22,075 | $2,225 | $19,850 |
| 2020 | $721 | $22,075 | $2,225 | $19,850 |
| 2019 | $721 | $22,075 | $2,225 | $19,850 |
| 2018 | $713 | $22,075 | $2,225 | $19,850 |
| 2017 | $705 | $22,075 | $2,225 | $19,850 |
| 2016 | $746 | $22,400 | $2,125 | $20,275 |
| 2015 | $746 | $22,400 | $2,125 | $20,275 |
| 2014 | $722 | $21,675 | $2,125 | $19,550 |
Property History
| Date | Event | Price | List to Sale | Price per Sq Ft |
|---|---|---|---|---|
| 10/27/2025 10/27/25 | For Sale | $269,000 | -- | $203 / Sq Ft |
Purchase History
| Date | Type | Sale Price | Title Company |
|---|---|---|---|
| Warranty Deed | $229,900 | -- | |
| Warranty Deed | $90,000 | -- | |
| Deed | $98,500 | -- | |
| Deed | $50,000 | -- | |
| Warranty Deed | -- | -- | |
| Warranty Deed | $24,400 | -- | |
| Warranty Deed | $23,000 | -- |
Mortgage History
| Date | Status | Loan Amount | Loan Type |
|---|---|---|---|
| Open | $6,000 | No Value Available | |
| Open | $231,691 | New Conventional |
Source: Greater Chattanooga REALTORS®
MLS Number: 1523008
APN: 054-004.27
Disclaimer: Certain information contained herein is derived from information provided by parties other than Homes.com. All information provided is deemed reliable, but is not guaranteed to be accurate and should be independently verified.
![]() IDX information is provided exclusively for consumers’ personal, noncommercial use, that it may not be used for any purpose other than to identify prospective properties consumers may be interested in purchasing.
IDX information is provided exclusively for consumers’ personal, noncommercial use, that it may not be used for any purpose other than to identify prospective properties consumers may be interested in purchasing.
Data is deemed reliable but is not guaranteed accurate by the MLS.
Ten-X does not display the entire MLS of Chattanooga, Inc. database on this website. The listings of some real estate brokerage firms have been excluded. Some or all of the listings displayed may not belong to the firm whose website is being visited
Copyright© 2025 by Chattanooga Association of REALTORS®
- 89 Clover Dale Rd S
- 35 Hummingbird Ln
- 0 Grandview Dr Unit 1523011
- 43 John Burch Rd W
- 94 Galloway Airport Rd
- 33 John Burch Rd W
- 108 Galloway Airport Rd
- 0 John Burch Rd Unit RTC2705187
- 0 John Burch Rd Unit A 1395827
- 132 Galloway Airport Rd
- 13875 Rankin Ave
- 919 John Burch Rd
- 0 Treeline Dr Unit 1510685
- 0 Treeline Dr Unit RTC2815537
- 0 Treeline Dr Unit 1510684
- 0 Treeline Dr Unit RTC2815536
- 208 Treeline Dr
- 5 Treeline Dr
- 4 Treeline Dr
- 23 Michigan Ln
- 10 Garden Court Loop
- 434 N Pine St
- 7155 Sawyer Rd
- 2268 Lusk Loop Rd
- 629 Parsons Ln
- 642 Belletrace Cir
- 129A Shearer St Unit A
- 9449 Dayton Pike
- 6275 Teletha Ln
- 5563 Stream Ln
- 5559 Stream Ln
- 151 Integra Vista Dr
- 5468 Abby Grace Loop
- 650 Moonlit Trail
- 11932 Dayton Pike
- 104 Sunnybrook Trail
- 21752 River Canyon Rd
- 21752 River Canyon Rd Unit 21752J
- 21752 River Canyon Rd Unit 21726B
