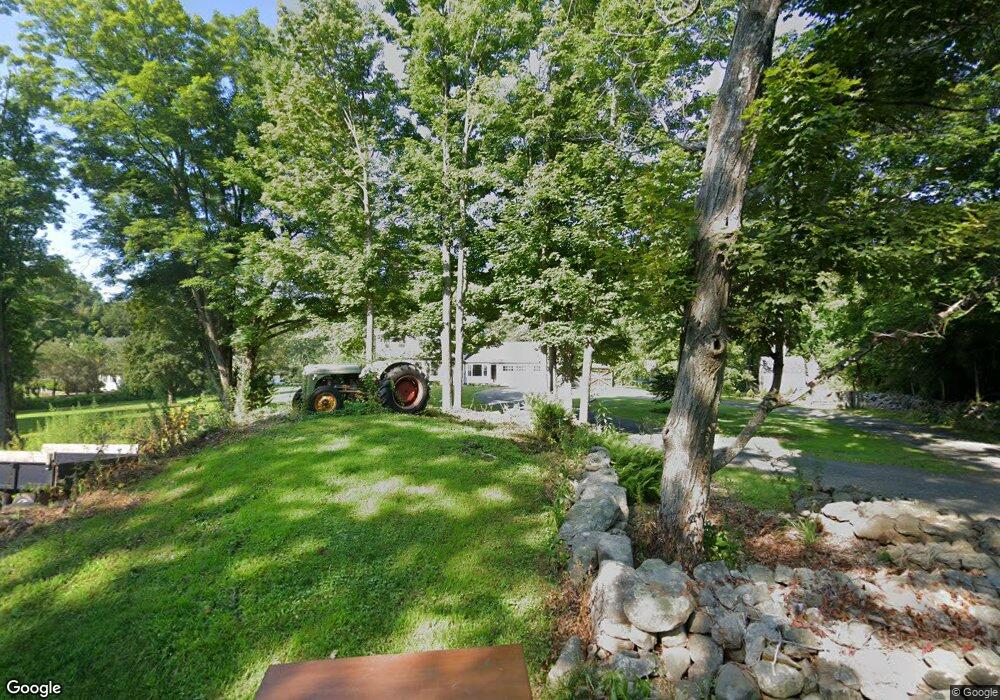
88 Gracey Rd Canton, CT 06019
Estimated Value: $396,000 - $463,573
3
Beds
7
Baths
1,912
Sq Ft
$226/Sq Ft
Est. Value
About This Home
This home is located at 88 Gracey Rd, Canton, CT 06019 and is currently estimated at $431,643, approximately $225 per square foot. 88 Gracey Rd is a home located in Hartford County with nearby schools including Cherry Brook Primary School, Canton Intermediate School, and Canton Middle School.
Ownership History
Date
Name
Owned For
Owner Type
Purchase Details
Closed on
May 22, 2017
Sold by
Frick Joshua A
Bought by
Bassett Jeremiah G
Current Estimated Value
Home Financials for this Owner
Home Financials are based on the most recent Mortgage that was taken out on this home.
Original Mortgage
$226,000
Outstanding Balance
$187,947
Interest Rate
4.1%
Mortgage Type
Purchase Money Mortgage
Estimated Equity
$243,696
Purchase Details
Closed on
Sep 30, 2014
Sold by
Jaglowski Kristen L
Bought by
Frick Joshua A
Home Financials for this Owner
Home Financials are based on the most recent Mortgage that was taken out on this home.
Original Mortgage
$220,000
Interest Rate
4.12%
Mortgage Type
New Conventional
Purchase Details
Closed on
Feb 10, 2011
Sold by
Jp Morgan Chase Bk
Bought by
Frick Joshua A and Jaglowski Krister L
Purchase Details
Closed on
Feb 22, 2010
Sold by
Hammond Joseph F
Bought by
American Business Mtg and Jp Morgan Chase Svcs
Create a Home Valuation Report for This Property
The Home Valuation Report is an in-depth analysis detailing your home's value as well as a comparison with similar homes in the area
Home Values in the Area
Average Home Value in this Area
Purchase History
| Date | Buyer | Sale Price | Title Company |
|---|---|---|---|
| Bassett Jeremiah G | $252,000 | -- | |
| Bassett Jeremiah G | $252,000 | -- | |
| Bassett Jeremiah G | $252,000 | -- | |
| Bassett Jeremiah G | $252,000 | -- | |
| Frick Joshua A | -- | -- | |
| Frick Joshua A | -- | -- | |
| Frick Joshua A | $215,000 | -- | |
| Frick Joshua A | $215,000 | -- | |
| American Business Mtg | -- | -- | |
| American Business Mtg | -- | -- |
Source: Public Records
Mortgage History
| Date | Status | Borrower | Loan Amount |
|---|---|---|---|
| Open | Bassett Jeremiah G | $226,000 | |
| Closed | Bassett Jeremiah G | $226,000 | |
| Previous Owner | American Business Mtg | $220,000 |
Source: Public Records
Tax History
| Year | Tax Paid | Tax Assessment Tax Assessment Total Assessment is a certain percentage of the fair market value that is determined by local assessors to be the total taxable value of land and additions on the property. | Land | Improvement |
|---|---|---|---|---|
| 2025 | $8,153 | $243,370 | $84,040 | $159,330 |
| 2024 | $8,311 | $243,370 | $84,040 | $159,330 |
| 2023 | $6,929 | $195,910 | $68,120 | $127,790 |
| 2022 | $6,600 | $195,910 | $68,120 | $127,790 |
| 2021 | $6,508 | $195,910 | $68,120 | $127,790 |
| 2020 | $6,385 | $195,910 | $68,120 | $127,790 |
| 2019 | $6,275 | $195,910 | $68,120 | $127,790 |
| 2018 | $5,841 | $190,260 | $70,220 | $120,040 |
| 2017 | $5,801 | $190,260 | $70,220 | $120,040 |
| 2016 | $5,662 | $190,260 | $70,220 | $120,040 |
| 2015 | $5,554 | $190,260 | $70,220 | $120,040 |
| 2014 | $5,434 | $190,270 | $70,230 | $120,040 |
Source: Public Records
Map
Nearby Homes
- 121 Gracey Rd
- 15 Red Fox Run
- 152 E Hill Rd
- 49 Applegate Ln Unit 49
- 70 E Hill Rd
- 13 Woodland Dr
- 26 Forest Ln
- 24 Ichabod Rd
- 28 Meadowview Ct Unit 28
- 12 Colony Rd
- 55 Dowd Ave Unit 22
- 35 Shingle Mill Rd
- 301 Bushy Hill Rd
- 308 Cherry Brook Rd
- 7 Shaw Dr
- 52 Shingle Mill Rd
- 14 Brookview Cir
- 21 Lakeview Blvd
- 29 Long View Dr
- 95 Dyer Ave
Your Personal Tour Guide
Ask me questions while you tour the home.