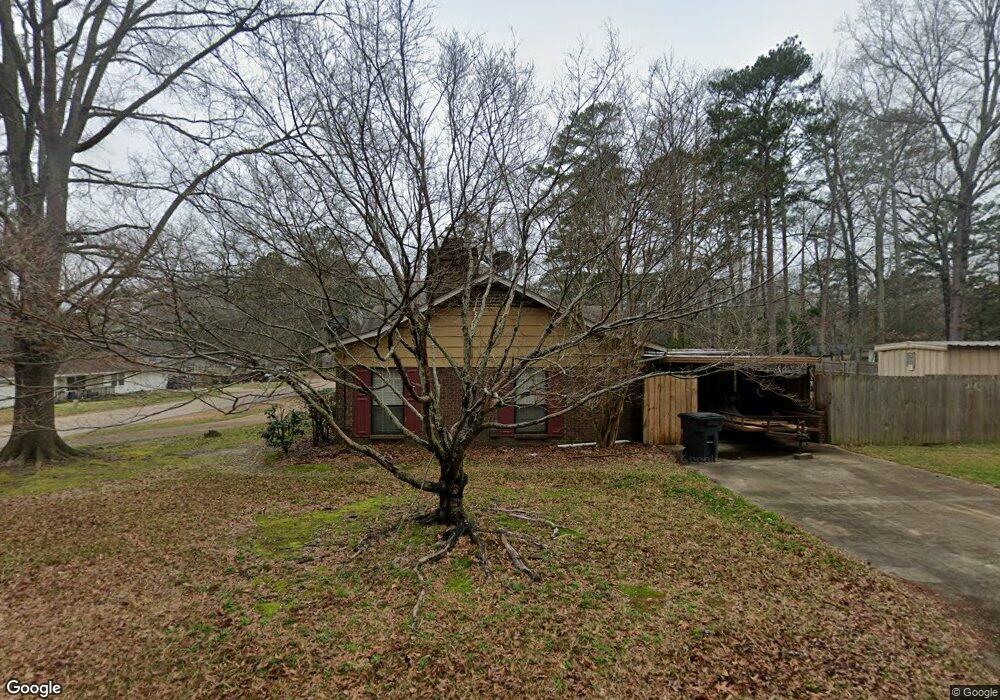
88 Woodbridge Cove Brandon, MS 39042
Estimated Value: $228,219 - $260,000
3
Beds
3
Baths
1,868
Sq Ft
$129/Sq Ft
Est. Value
About This Home
This home is located at 88 Woodbridge Cove, Brandon, MS 39042 and is currently estimated at $241,555, approximately $129 per square foot. 88 Woodbridge Cove is a home located in Rankin County with nearby schools including Rouse Elementary School, Brandon Elementary School, and Stonebridge Elementary School.
Ownership History
Date
Name
Owned For
Owner Type
Purchase Details
Closed on
Mar 23, 2022
Sold by
Donaldson Markshon
Bought by
Quarles Laura
Current Estimated Value
Home Financials for this Owner
Home Financials are based on the most recent Mortgage that was taken out on this home.
Original Mortgage
$196,377
Outstanding Balance
$183,417
Interest Rate
3.89%
Mortgage Type
FHA
Estimated Equity
$58,138
Purchase Details
Closed on
Sep 19, 2019
Sold by
Wealth Bridge Properties
Bought by
Donaldosn Markshon
Home Financials for this Owner
Home Financials are based on the most recent Mortgage that was taken out on this home.
Original Mortgage
$180,175
Interest Rate
5.5%
Mortgage Type
FHA
Purchase Details
Closed on
Sep 1, 2017
Sold by
Croxton Van H and Croxton Theresa Lee
Bought by
Wealth Bridge Properties Llc
Purchase Details
Closed on
Jun 12, 2007
Sold by
Branch Gene and Branch David
Bought by
Croxton Van H and Croxton Theresa L
Create a Home Valuation Report for This Property
The Home Valuation Report is an in-depth analysis detailing your home's value as well as a comparison with similar homes in the area
Home Values in the Area
Average Home Value in this Area
Purchase History
| Date | Buyer | Sale Price | Title Company |
|---|---|---|---|
| Quarles Laura | $198,340 | None Listed On Document | |
| Donaldosn Markshon | -- | -- | |
| Wealth Bridge Properties Llc | -- | None Available | |
| Croxton Van H | -- | -- |
Source: Public Records
Mortgage History
| Date | Status | Borrower | Loan Amount |
|---|---|---|---|
| Open | Donaldosn Markshon | $196,377 | |
| Previous Owner | Donaldosn Markshon | $180,175 |
Source: Public Records
Tax History Compared to Growth
Tax History
| Year | Tax Paid | Tax Assessment Tax Assessment Total Assessment is a certain percentage of the fair market value that is determined by local assessors to be the total taxable value of land and additions on the property. | Land | Improvement |
|---|---|---|---|---|
| 2024 | $2,659 | $20,372 | $0 | $0 |
| 2023 | $2,162 | $16,566 | $0 | $0 |
| 2022 | $1,125 | $11,044 | $0 | $0 |
| 2021 | $1,125 | $11,044 | $0 | $0 |
| 2020 | $1,125 | $11,044 | $0 | $0 |
| 2019 | $1,982 | $15,042 | $0 | $0 |
| 2018 | $1,952 | $15,042 | $0 | $0 |
| 2017 | $1,002 | $10,028 | $0 | $0 |
| 2016 | $916 | $10,068 | $0 | $0 |
| 2015 | $916 | $10,068 | $0 | $0 |
| 2014 | $895 | $10,068 | $0 | $0 |
| 2013 | -- | $10,068 | $0 | $0 |
Source: Public Records
Map
Nearby Homes
- 107 Woodgate Dr
- 54 Willowbrook Ln
- 92 Fern Valley Rd
- 58 Summit Ridge Dr
- 60 Summit Ridge Dr
- 36 Pebble Hill Dr
- 106 Fern Valley Rd
- 116 Long Meadow Ct
- 22 Fox Glen Cove
- 11 Sandway Dr
- 61 Sunline Dr
- 11 Terrapin Hill Rd S
- 37 Woodgate Dr
- 79 Terrapin Dr
- 111 Hickory Hill Place
- 135 Fawnwood Dr
- 69 Terrapin Dr
- 108 Fairdale Place
- 112 Fairdale Place
- 26 Woodgate Dr
- 88 Woodbridge Rd
- 92 Woodbridge Rd
- 79 Woodbridge Rd
- 86 Woodbridge Rd
- 81 Woodbridge Rd
- 80 Woodbridge Cove
- 77 Woodbridge Rd
- 84 Woodbridge Cove
- 82 Woodbridge Cove
- 83 Woodbridge Rd
- 94 Woodbridge Rd
- 78 Fern Valley Rd
- 72 Fern Valley Rd
- 74 Fern Valley Rd
- 76 Fern Valley Rd
- 75 Woodbridge Rd
- 47 Quail Ln
- 76 Woodbridge Rd
- 80 Fern Valley Rd
- 49 Quail Ln