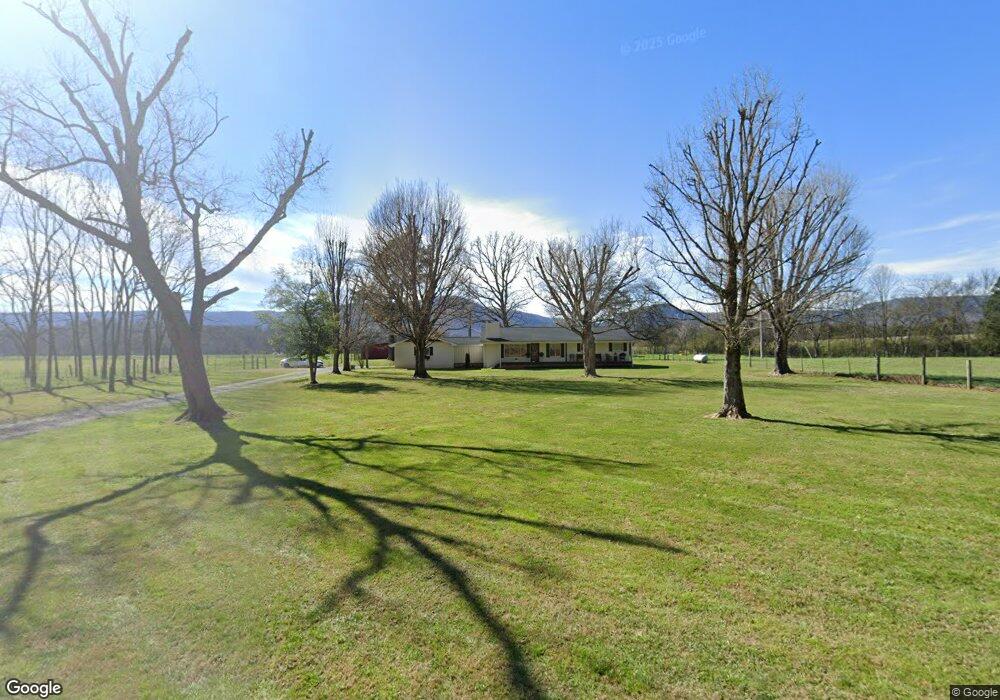
880 Davis Rd Dunlap, TN 37327
Estimated Value: $156,000
Studio
1
Bath
1,936
Sq Ft
$81/Sq Ft
Est. Value
About This Home
This home is located at 880 Davis Rd, Dunlap, TN 37327 and is currently estimated at $156,000, approximately $80 per square foot. 880 Davis Rd is a home located in Sequatchie County with nearby schools including Griffith Elementary School, Sequatchie County Middle School, and Sequatchie County High School.
Ownership History
Date
Name
Owned For
Owner Type
Purchase Details
Closed on
Jul 13, 2020
Sold by
Smith Michael
Bought by
Dean James T and Dean Christine J
Current Estimated Value
Purchase Details
Closed on
Feb 20, 2020
Sold by
Gillentine Patricia Diane and Smith Martha Jill
Bought by
Smith Michael
Purchase Details
Closed on
Feb 4, 2020
Sold by
Davis Aline
Bought by
Dean James T and Dean Christie J
Purchase Details
Closed on
Oct 22, 2019
Sold by
Smith Michael and Clark Sue
Bought by
Dean James T and Dean Christie J
Purchase Details
Closed on
Jun 3, 2017
Sold by
Davis Aline
Bought by
Davis Aline Clark Sue
Purchase Details
Closed on
Jan 12, 2009
Bought by
Davis Thurston and Clark Sue
Purchase Details
Closed on
Oct 17, 2007
Bought by
Davis Thurston
Purchase Details
Closed on
Jul 10, 1998
Sold by
Thurston Davis
Bought by
Freeman J W
Purchase Details
Closed on
Mar 1, 1993
Bought by
Davis Thurston
Purchase Details
Closed on
Jul 1, 1988
Bought by
Davis Thurman
Create a Home Valuation Report for This Property
The Home Valuation Report is an in-depth analysis detailing your home's value as well as a comparison with similar homes in the area
Home Values in the Area
Average Home Value in this Area
Purchase History
| Date | Buyer | Sale Price | Title Company |
|---|---|---|---|
| Dean James T | -- | None Available | |
| Smith Michael | -- | None Available | |
| Dean James T | -- | None Available | |
| Dean James T | $175,000 | None Available | |
| Davis Aline Clark Sue | -- | -- | |
| Clark Sue | -- | None Available | |
| Davis Thurston | -- | -- | |
| Davis Thurston | $10,000 | -- | |
| Freeman J W | $57,500 | -- | |
| Davis Thurston | $15,000 | -- | |
| Davis Thurman | $4,800 | -- |
Source: Public Records
Tax History
| Year | Tax Paid | Tax Assessment Tax Assessment Total Assessment is a certain percentage of the fair market value that is determined by local assessors to be the total taxable value of land and additions on the property. | Land | Improvement |
|---|---|---|---|---|
| 2025 | $91 | $4,950 | $4,950 | $0 |
| 2024 | $91 | $4,950 | $4,950 | $0 |
| 2023 | $91 | $4,950 | $4,950 | $0 |
| 2022 | $96 | $3,925 | $3,925 | $0 |
| 2021 | $96 | $3,925 | $3,925 | $0 |
| 2020 | $96 | $3,925 | $3,925 | $0 |
| 2019 | $620 | $25,400 | $8,450 | $16,950 |
| 2018 | $606 | $24,800 | $8,450 | $16,350 |
| 2017 | $606 | $24,800 | $8,450 | $16,350 |
| 2016 | $639 | $24,875 | $7,800 | $17,075 |
| 2015 | $127 | $4,925 | $4,125 | $800 |
| 2014 | $127 | $4,925 | $4,125 | $800 |
Source: Public Records
Map
Nearby Homes
- 157 Bear Oak Dr
- 249 Bear Oak Dr
- 239 Bear Oak Dr
- 79 Bear Oak Dr
- 1086 River Ridge Dr
- 1086 River Ridge Dr Unit Lot 58
- 18298 Rankin Ave
- 134 River Ridge Dr Unit 117
- 134 River Ridge Dr
- 267 Williams Rd
- 217 A Day Dream Dr
- 481 Tram Trail
- 402 Old State Highway 8
- 453 Hill Cir
- 87 Happy Valley Rd
- 2 Smith Rd
- 1038 Sawmill Creek Rd
- 2 Fredonia Rd
- 3 Fredonia Rd
- 1 Fredonia Rd
- 1091 Davis Rd
- 1 Brush Creek Rd
- 0 Brush Creek Rd
- 0 Brush Creek Rd Unit 985345
- 0 Brush Creek Rd Unit 982901
- 0 Brush Creek Rd Unit 993476
- 0 Brush Creek Rd Unit 976754
- 0 Brush Creek Rd Unit 1104843
- 0 Brush Creek Rd Unit 1000348
- 0 Brush Creek Rd Unit 1037252
- 0 Brush Creek Rd Unit 1097632
- 0 Brush Creek Rd Unit 1006665
- 0 Brush Creek Rd Unit 1152278
- 2 Brush Creek Rd
- 0 Pebble Dr
- 324 Brush Creek Rd
- 51 Pebble Dr
- 45 Pebble Dr
- 296 Brush Creek Rd
- 54 Pebble Dr
Your Personal Tour Guide
Ask me questions while you tour the home.