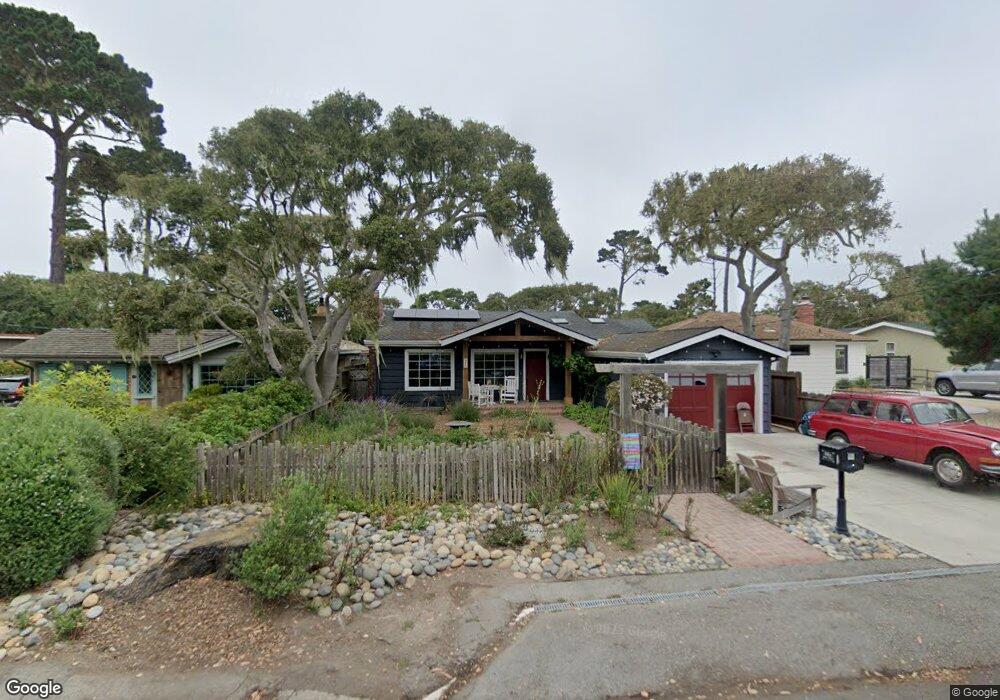
880 Maple St Pacific Grove, CA 93950
Estimated Value: $1,804,000 - $1,964,184
3
Beds
2
Baths
2,359
Sq Ft
$793/Sq Ft
Est. Value
About This Home
This home is located at 880 Maple St, Pacific Grove, CA 93950 and is currently estimated at $1,869,546, approximately $792 per square foot. 880 Maple St is a home located in Monterey County with nearby schools including Forest Grove Elementary School, Pacific Grove Middle School, and Pacific Grove High School.
Ownership History
Date
Name
Owned For
Owner Type
Purchase Details
Closed on
Oct 29, 2002
Sold by
Smith Marisa Y and Pierce Robert D
Bought by
Provost Ronald J and Durfee Kirsten C
Current Estimated Value
Home Financials for this Owner
Home Financials are based on the most recent Mortgage that was taken out on this home.
Original Mortgage
$503,300
Outstanding Balance
$209,724
Interest Rate
5.95%
Estimated Equity
$1,659,822
Purchase Details
Closed on
Apr 12, 2000
Sold by
Church Gisela W
Bought by
Pierce Robert D and Smith Marisa Y
Home Financials for this Owner
Home Financials are based on the most recent Mortgage that was taken out on this home.
Original Mortgage
$447,200
Interest Rate
8.12%
Purchase Details
Closed on
Mar 16, 1994
Sold by
Church Louis G
Bought by
Church Gisela W
Home Financials for this Owner
Home Financials are based on the most recent Mortgage that was taken out on this home.
Original Mortgage
$185,000
Interest Rate
7.21%
Create a Home Valuation Report for This Property
The Home Valuation Report is an in-depth analysis detailing your home's value as well as a comparison with similar homes in the area
Home Values in the Area
Average Home Value in this Area
Purchase History
| Date | Buyer | Sale Price | Title Company |
|---|---|---|---|
| Provost Ronald J | -- | Stewart Title Of Ca | |
| Pierce Robert D | -- | Stewart Title | |
| Church Gisela W | -- | Stewart Title |
Source: Public Records
Mortgage History
| Date | Status | Borrower | Loan Amount |
|---|---|---|---|
| Open | Provost Ronald J | $503,300 | |
| Previous Owner | Pierce Robert D | $447,200 | |
| Previous Owner | Church Gisela W | $185,000 |
Source: Public Records
Tax History
| Year | Tax Paid | Tax Assessment Tax Assessment Total Assessment is a certain percentage of the fair market value that is determined by local assessors to be the total taxable value of land and additions on the property. | Land | Improvement |
|---|---|---|---|---|
| 2025 | $11,845 | $1,139,173 | $868,999 | $270,174 |
| 2024 | $11,845 | $1,116,837 | $851,960 | $264,877 |
| 2023 | $11,937 | $1,094,939 | $835,255 | $259,684 |
| 2022 | $11,693 | $1,073,471 | $818,878 | $254,593 |
| 2021 | $11,631 | $1,052,423 | $802,822 | $249,601 |
| 2020 | $11,396 | $1,041,633 | $794,591 | $247,042 |
| 2019 | $11,030 | $1,021,210 | $779,011 | $242,199 |
| 2018 | $10,807 | $1,001,187 | $763,737 | $237,450 |
| 2017 | $10,629 | $981,557 | $748,762 | $232,795 |
| 2016 | $10,654 | $962,312 | $734,081 | $228,231 |
| 2015 | $9,771 | $884,000 | $674,000 | $210,000 |
| 2014 | $9,468 | $858,000 | $655,000 | $203,000 |
Source: Public Records
Map
Nearby Homes
- 860 Sunset Dr
- 805 Sinex Ave
- 745 Sinex Ave
- 712 Sunset Dr
- 791 Spruce Ave
- 52 Country Club Gate
- 851 Laurel Ave
- 56 Spanish Bay Cir
- 311 Lobos Ave
- 64 Spanish Bay Cir
- 618 Forest Ave
- 226 Willow St
- 302 Park St
- 605 Acorn Ct
- 206 Cypress Ave Unit B
- 306 Crocker Ave
- 224 16th St
- 515 13th St
- 879 Lottie St
- 1113 Presidio Blvd
Your Personal Tour Guide
Ask me questions while you tour the home.