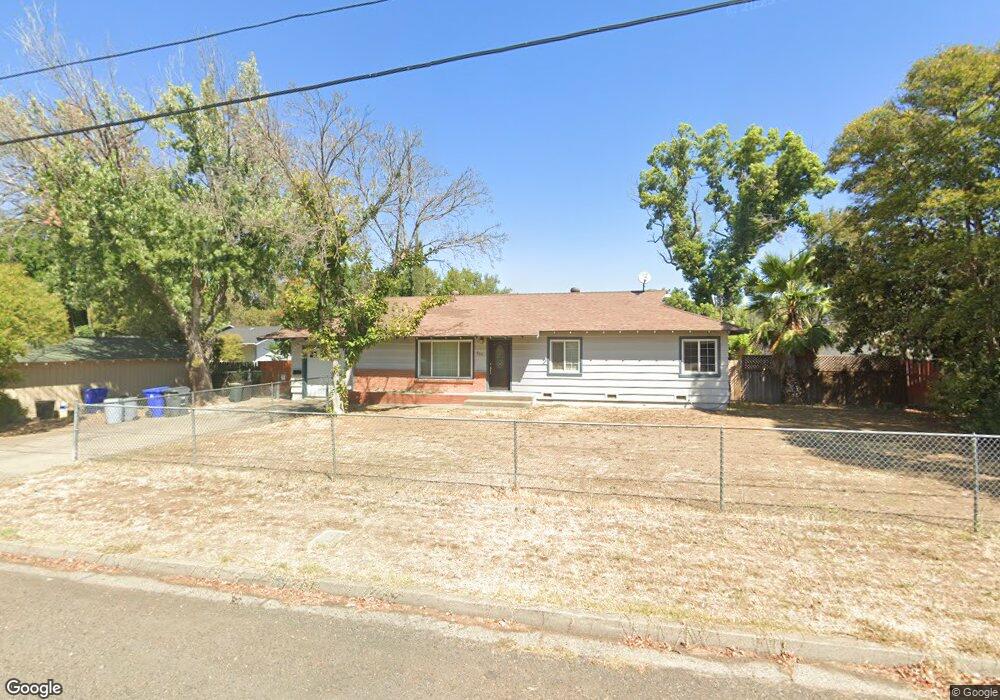
880 Orange St Red Bluff, CA 96080
Estimated Value: $272,000 - $278,473
3
Beds
2
Baths
1,261
Sq Ft
$219/Sq Ft
Est. Value
About This Home
This home is located at 880 Orange St, Red Bluff, CA 96080 and is currently estimated at $275,618, approximately $218 per square foot. 880 Orange St is a home located in Tehama County with nearby schools including Jackson Heights Elementary School, Vista Preparatory Academy, and Red Bluff High School.
Ownership History
Date
Name
Owned For
Owner Type
Purchase Details
Closed on
Mar 2, 2021
Sold by
Culligan Linda Marie
Bought by
Smith James Guy
Current Estimated Value
Home Financials for this Owner
Home Financials are based on the most recent Mortgage that was taken out on this home.
Original Mortgage
$178,500
Outstanding Balance
$160,013
Interest Rate
2.7%
Mortgage Type
New Conventional
Estimated Equity
$115,605
Purchase Details
Closed on
Sep 20, 2007
Sold by
Culligan Thomas Paul
Bought by
Culligan Linda Marie
Home Financials for this Owner
Home Financials are based on the most recent Mortgage that was taken out on this home.
Original Mortgage
$127,000
Interest Rate
6.61%
Mortgage Type
New Conventional
Purchase Details
Closed on
Apr 18, 2003
Sold by
Culligan Thomas Paul and Culligan Linda Marie
Bought by
Culligan Thomas Paul and Weiser Larman B
Create a Home Valuation Report for This Property
The Home Valuation Report is an in-depth analysis detailing your home's value as well as a comparison with similar homes in the area
Purchase History
| Date | Buyer | Sale Price | Title Company |
|---|---|---|---|
| Smith James Guy | $210,000 | Placer Title Company | |
| Culligan Linda Marie | -- | First American Title | |
| Culligan Thomas Paul | -- | -- |
Source: Public Records
Mortgage History
| Date | Status | Borrower | Loan Amount |
|---|---|---|---|
| Open | Smith James Guy | $178,500 | |
| Previous Owner | Culligan Linda Marie | $127,000 |
Source: Public Records
Tax History
| Year | Tax Paid | Tax Assessment Tax Assessment Total Assessment is a certain percentage of the fair market value that is determined by local assessors to be the total taxable value of land and additions on the property. | Land | Improvement |
|---|---|---|---|---|
| 2025 | $2,567 | $259,782 | $54,121 | $205,661 |
| 2023 | $2,523 | $249,696 | $52,020 | $197,676 |
| 2022 | $2,504 | $244,800 | $51,000 | $193,800 |
| 2021 | $1,348 | $130,427 | $30,680 | $99,747 |
| 2020 | $1,376 | $129,091 | $30,366 | $98,725 |
| 2019 | $1,385 | $126,561 | $29,771 | $96,790 |
| 2018 | $1,281 | $124,081 | $29,188 | $94,893 |
| 2017 | $1,292 | $121,649 | $28,616 | $93,033 |
| 2016 | $1,207 | $119,264 | $28,055 | $91,209 |
| 2015 | $1,188 | $117,473 | $27,634 | $89,839 |
| 2014 | $1,171 | $115,173 | $27,093 | $88,080 |
Source: Public Records
Map
Nearby Homes
- 845 Olive St
- 406 S Jackson St
- 1160 Orange St
- 224 S Jackson St
- 425 S Jackson St
- 660 Villa Dr
- 1210 Wetter Way
- 1212 S Jackson St
- 1455 Acacia St
- 1280 Southpointe Dr
- 629 Johnson St
- 1235 Britt Ln
- 1660 El Cerrito Ct
- 728 Lincoln St
- 524 Madison St
- 532 Madison St
- 855 Johnson St
- 541 Jefferson St
- 927 Cedar St
- 180 S Main St
- 870 Orange St
- 875 Olive St
- 413 Griffin Way
- 888 Orange St
- 866 Orange St
- 865 Olive St
- 883 Olive St Unit 883 1/2 & 887
- 875 Orange St
- 862 Orange St
- 885 Orange St
- 867 Orange St
- 889 Orange St
- 857 Olive St
- 858 Orange St
- 410 Griffin Way
- 2888 Olive St
- 895 Olive St
- 893 Orange St
- 857 Orange St
- 950 Ashmount Ave
Your Personal Tour Guide
Ask me questions while you tour the home.