
Landlord's Agent in 2020
Paul Gerace
Ace Properties
(512) 487-2846
1 in this area
11 Total Sales
Estimated Value: $454,317 - $607,000
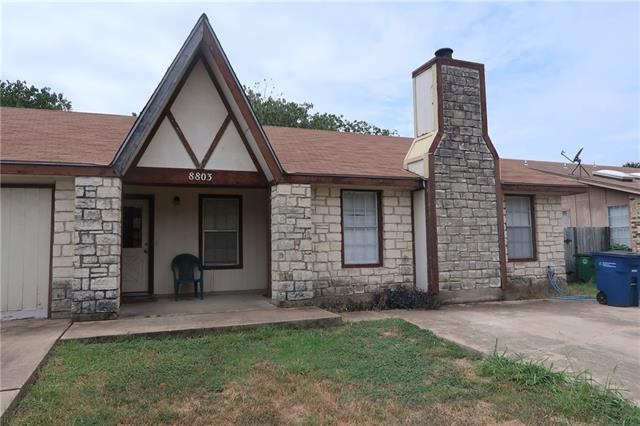
Close to shopping and Lakeline Mall. Easy access to HWY 183, Toll 45, HWY 620 and Parmer. Great neighborhood to live in. Walking distance to Live Oak Elementary and Deerpark Middle School. Walking distance to Springwoods Park on Anderson Mill Rd.FEMA - Unknown
We collect this data history from publicly available records. To have your information removed, we recommend requesting removal directly through your county’s website.
| Date | Buyer | Sale Price | Title Company |
|---|---|---|---|
| Olvera Edurado | $4,500 | None Available | |
| Ham Wan Kyun | -- | None Available |
We collect this data history from publicly available records. To have your information removed, we recommend requesting removal directly through your county’s website.
| Date | Status | Borrower | Loan Amount |
|---|---|---|---|
| Previous Owner | Ham Wan Kyun | $116,000 |
| Date | Event | Price | List to Sale | Price per Sq Ft |
|---|---|---|---|---|
| 09/18/2020 09/18/20 | Rented | $1,100 | 0.0% | -- |
| 09/16/2020 09/16/20 | Under Contract | -- | -- | -- |
| 09/10/2020 09/10/20 | For Rent | $1,100 | 0.0% | -- |
| 09/07/2020 09/07/20 | Under Contract | -- | -- | -- |
| 09/02/2020 09/02/20 | For Rent | $1,100 | +4.8% | -- |
| 05/13/2019 05/13/19 | Rented | $1,050 | 0.0% | -- |
| 05/10/2019 05/10/19 | Under Contract | -- | -- | -- |
| 05/04/2019 05/04/19 | For Rent | $1,050 | 0.0% | -- |
| 02/08/2018 02/08/18 | Rented | $1,050 | 0.0% | -- |
| 01/27/2018 01/27/18 | Under Contract | -- | -- | -- |
| 12/20/2017 12/20/17 | For Rent | $1,050 | +44.8% | -- |
| 07/30/2012 07/30/12 | Rented | $725 | 0.0% | -- |
| 07/26/2012 07/26/12 | Under Contract | -- | -- | -- |
| 07/24/2012 07/24/12 | For Rent | $725 | -- | -- |
| Year | Tax Paid | Tax Assessment Tax Assessment Total Assessment is a certain percentage of the fair market value that is determined by local assessors to be the total taxable value of land and additions on the property. | Land | Improvement |
|---|---|---|---|---|
| 2025 | $9,842 | $460,520 | $96,300 | $364,220 |
| 2024 | $9,842 | $521,041 | $106,000 | $415,041 |
| 2023 | $10,009 | $538,715 | $120,000 | $418,715 |
| 2022 | $10,264 | $508,850 | $97,000 | $411,850 |
| 2021 | $9,344 | $399,430 | $77,000 | $322,430 |
| 2020 | $7,527 | $332,844 | $72,306 | $260,538 |
| 2019 | $7,698 | $330,553 | $67,500 | $263,053 |
| 2018 | $7,889 | $338,731 | $63,237 | $275,494 |
| 2017 | $7,223 | $304,440 | $59,100 | $245,340 |
| 2016 | $6,694 | $282,136 | $59,100 | $223,036 |
| 2015 | $5,325 | $254,754 | $48,100 | $206,654 |
| 2014 | $5,325 | $220,131 | $0 | $0 |
Landlord's Agent in 2020
Paul Gerace
Ace Properties
(512) 487-2846
1 in this area
11 Total Sales
Buyer's Agent in 2012
Michael Hughes
JBGoodwin REALTORS NW
(512) 680-9152
3 Total Sales
Source: Unlock MLS (Austin Board of REALTORS®)
MLS Number: 5762892
APN: R074068
Disclaimer: Certain information contained herein is derived from information provided by parties other than Homes.com. All information provided is deemed reliable, but is not guaranteed to be accurate and should be independently verified.
![]() Based on information from the Austin Board of REALTORS® (alternatively, from ACTRIS). Neither the Board nor ACTRIS guarantees or is in any way responsible for its accuracy. All data is provided “AS IS” and with all faults. Data maintained by the Board or ACTRIS may not reflect all real estate activity in the market.
Based on information from the Austin Board of REALTORS® (alternatively, from ACTRIS). Neither the Board nor ACTRIS guarantees or is in any way responsible for its accuracy. All data is provided “AS IS” and with all faults. Data maintained by the Board or ACTRIS may not reflect all real estate activity in the market.
Information being provided is for consumers’ personal, non-commercial use and may not be used for any purpose other than to identify prospective properties consumers may be interested in purchasing. All data is obtained from various sources and may not have been verified by broker or MLS GRID. Supplied Open House Information is subject to change without notice. All information should be independently reviewed and verified for accuracy. Properties may or may not be listed by the office/agent presenting the information. Some IDX listings have been excluded from this website.
Based on information submitted to the MLS GRID
Listings courtesy of Unlock MLS (Austin Board of REALTORS®) as distributed by MLS GRID
Ask me questions while you tour the home.