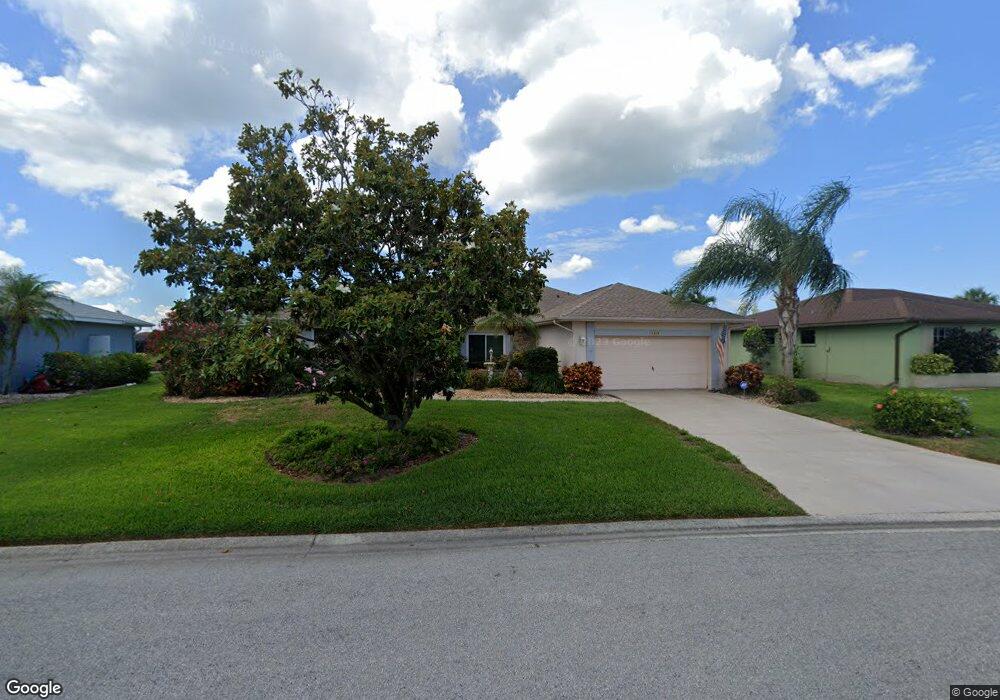
8804 50th Ave W Bradenton, FL 34210
Estimated Value: $510,000 - $714,000
3
Beds
2
Baths
1,848
Sq Ft
$328/Sq Ft
Est. Value
About This Home
This home is located at 8804 50th Ave W, Bradenton, FL 34210 and is currently estimated at $606,975, approximately $328 per square foot. 8804 50th Ave W is a home located in Manatee County with nearby schools including Sea Breeze Elementary School, W. D. Sugg Middle School, and Bayshore High School.
Ownership History
Date
Name
Owned For
Owner Type
Purchase Details
Closed on
Dec 15, 2016
Sold by
Lgc Llc
Bought by
Vollmann Joseph and Vollmann Susan
Current Estimated Value
Purchase Details
Closed on
Jan 19, 2016
Sold by
Ravkin Yury
Bought by
Lgc Llc
Purchase Details
Closed on
Jan 1, 2016
Bought by
Vollmann Joseph
Purchase Details
Closed on
Aug 15, 2009
Sold by
Reno Gerald A and Renault Sandra
Bought by
Ravkin Yury and Trust 2572
Purchase Details
Closed on
Jul 10, 2009
Sold by
Reno Gerald A and Estate Of Marilyn A Reno
Bought by
Ravkin Yury and Trust #2575
Purchase Details
Closed on
Aug 29, 1996
Sold by
Malan Edward G
Bought by
Reno Harold B and Reno Marilyn A
Home Financials for this Owner
Home Financials are based on the most recent Mortgage that was taken out on this home.
Original Mortgage
$111,200
Interest Rate
8.2%
Create a Home Valuation Report for This Property
The Home Valuation Report is an in-depth analysis detailing your home's value as well as a comparison with similar homes in the area
Home Values in the Area
Average Home Value in this Area
Purchase History
| Date | Buyer | Sale Price | Title Company |
|---|---|---|---|
| Vollmann Joseph | $320,000 | Attorney | |
| Lgc Llc | -- | None Available | |
| Vollmann Joseph | $100 | -- | |
| Ravkin Yury | -- | Attorney | |
| Ravkin Yury | $220,000 | None Available | |
| Reno Harold B | $139,000 | -- |
Source: Public Records
Mortgage History
| Date | Status | Borrower | Loan Amount |
|---|---|---|---|
| Previous Owner | Reno Harold B | $111,200 |
Source: Public Records
Tax History Compared to Growth
Tax History
| Year | Tax Paid | Tax Assessment Tax Assessment Total Assessment is a certain percentage of the fair market value that is determined by local assessors to be the total taxable value of land and additions on the property. | Land | Improvement |
|---|---|---|---|---|
| 2025 | $3,194 | $254,937 | -- | -- |
| 2024 | $3,194 | $247,752 | -- | -- |
| 2023 | $3,132 | $240,536 | $0 | $0 |
| 2022 | $3,106 | $233,530 | $0 | $0 |
| 2021 | $2,975 | $226,728 | $0 | $0 |
| 2020 | $3,069 | $223,598 | $60,000 | $163,598 |
| 2019 | $3,166 | $228,514 | $0 | $0 |
| 2018 | $3,139 | $224,253 | $0 | $0 |
| 2017 | $2,920 | $219,641 | $0 | $0 |
| 2016 | $3,464 | $215,165 | $0 | $0 |
| 2015 | $3,005 | $196,501 | $0 | $0 |
| 2014 | $3,005 | $178,090 | $0 | $0 |
| 2013 | $2,918 | $170,275 | $33,300 | $136,975 |
Source: Public Records
Map
Nearby Homes
- 8607 51st Ave W
- 5207 88th St W
- 5011 Mangrove Point Rd
- 8703 53rd Ave W
- 5107 86th Street Ct W
- 5207 86th Street Ct W
- 5207 Bimini Dr
- 8710 54th Ave W Unit 16
- 8706 54th Ave W Unit 18
- 8642 54th Ave W Unit 23
- 4523 86th Street Ct W
- 4821 Mount Vernon Dr Unit 4821
- 4511/4513 87th Street Ct W
- 4455 - 4457 87th Street Ct W
- 4503 Coral Lake Dr
- 4451 87th Street Ct W
- 8808 44th Avenue Dr W
- 4714 Potomac Cir
- 4419 Mangrove Point Rd
- 4809 Independence Dr Unit 4809
- 8808 50th Ave W
- 8712 50th Ave W
- 8708 50th Ave W
- 8812 50th Ave W
- 8803 50th Ave W
- 8803 51st Ave W
- 8711 51st Ave W
- 8807 50th Ave W
- 8711 50th Ave W
- 8704 50th Ave W
- 8807 51st Ave W
- 5007 Coral Lake Dr
- 8811 50th Ave W
- 8707 51st Ave W
- 8816 50th Ave W
- 5011 Coral Lake Dr
- 8707 50th Ave W
- 5011 89th St W
- 8815 50th Ave W
- 8703 51st Ave W