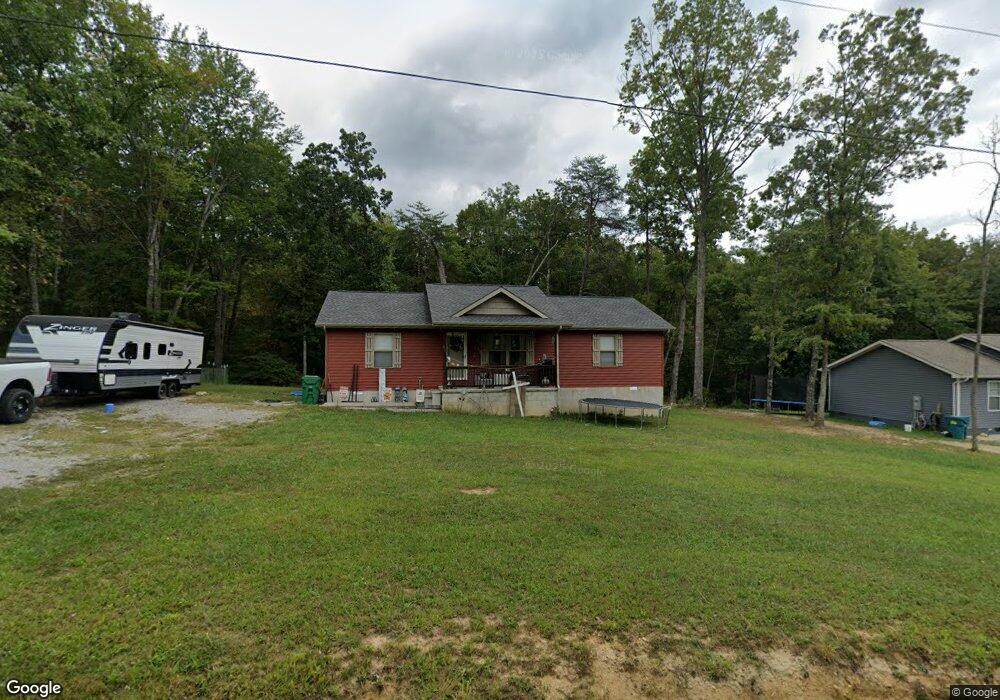
881 Riverchase Trail Clarkrange, TN 38553
Estimated Value: $256,000 - $360,000
Studio
--
Bath
1,300
Sq Ft
$220/Sq Ft
Est. Value
About This Home
This home is located at 881 Riverchase Trail, Clarkrange, TN 38553 and is currently estimated at $286,412, approximately $220 per square foot. 881 Riverchase Trail is a home.
Ownership History
Date
Name
Owned For
Owner Type
Purchase Details
Closed on
Sep 27, 2019
Sold by
Smith Russell W and Smith Carol A
Bought by
York Destanie N and York Lukas M
Current Estimated Value
Home Financials for this Owner
Home Financials are based on the most recent Mortgage that was taken out on this home.
Original Mortgage
$140,404
Outstanding Balance
$122,983
Interest Rate
3.6%
Mortgage Type
New Conventional
Estimated Equity
$163,429
Purchase Details
Closed on
Sep 21, 2018
Sold by
Sampley John and Sampley Connie
Bought by
Smith Russell W and Smith Carol A
Purchase Details
Closed on
Jun 4, 2015
Sold by
Allen Mariano Baricuatro
Bought by
Sampley John
Purchase Details
Closed on
May 2, 2014
Sold by
Miller Michael Oliver
Bought by
Allen Mariano Baricuatro
Purchase Details
Closed on
Aug 29, 2013
Sold by
Miller Sheila
Bought by
Miller Michael
Purchase Details
Closed on
Feb 25, 2011
Bought by
Miller Michael Oliver
Purchase Details
Closed on
Jan 1, 2008
Sold by
Clarkrange Properties Llc
Bought by
Clark Glenn
Create a Home Valuation Report for This Property
The Home Valuation Report is an in-depth analysis detailing your home's value as well as a comparison with similar homes in the area
Purchase History
| Date | Buyer | Sale Price | Title Company |
|---|---|---|---|
| York Destanie N | $139,000 | None Available | |
| Smith Russell W | $5,000 | None Available | |
| Sampley John | $5,000 | -- | |
| Allen Mariano Baricuatro | $6,000 | -- | |
| Miller Michael | -- | -- | |
| Miller Michael Oliver | $3,800 | -- | |
| Miller Michael Oliver | $3,750 | -- | |
| Clark Glenn | -- | -- |
Source: Public Records
Mortgage History
| Date | Status | Borrower | Loan Amount |
|---|---|---|---|
| Open | York Destanie N | $140,404 |
Source: Public Records
Tax History
| Year | Tax Paid | Tax Assessment Tax Assessment Total Assessment is a certain percentage of the fair market value that is determined by local assessors to be the total taxable value of land and additions on the property. | Land | Improvement |
|---|---|---|---|---|
| 2025 | $631 | $46,775 | $4,125 | $42,650 |
| 2024 | $631 | $46,775 | $4,125 | $42,650 |
| 2023 | $631 | $46,775 | $4,125 | $42,650 |
| 2022 | $614 | $32,150 | $2,475 | $29,675 |
| 2021 | $614 | $32,150 | $2,475 | $29,675 |
| 2020 | $614 | $32,150 | $2,475 | $29,675 |
| 2019 | $428 | $32,150 | $2,475 | $29,675 |
| 2018 | $47 | $2,475 | $2,475 | $0 |
| 2017 | $49 | $2,475 | $2,475 | $0 |
| 2016 | $49 | $2,475 | $2,475 | $0 |
| 2015 | $49 | $2,478 | $0 | $0 |
| 2014 | -- | $2,478 | $0 | $0 |
Source: Public Records
Map
Nearby Homes
- 908 Riverchase Trail
- 908 River Chase Trail
- 6940 S York Hwy
- 6604 S York Hwy
- 4.47 ac 523 Ferry Bend Tr
- 447 523 Ferry Bend Tr
- 164 Green Acres
- 0 Ferry Bend Tr Unit 1292974
- 0 Ferry Bend Tr Unit RTC2995085
- 0 Ferry Bend Tr Unit RTC2995089
- 0 Ferry Bend Tr Unit 1292975
- 0 Ferry Bend Tr Unit 1292679
- 0 Ferry Bend Tr Unit RTC2995090
- 523 Ferry Bend Trail
- 4.47 ac 523 Ferry Bend Trail
- 515 Ferry Bend Trail
- 469 Ferry Bend Trail
- Lot 12 Ferry Bend Trail
- Lot 11 Ferry Bend Trail
- Lot 10 Ferry Bend Trail
- 881 River Chase Trail
- 0 River Chase Tr Unit 909629
- 0 River Chase Tr Unit 910719
- 0 River Chase Tr Unit 1065489
- 0 River Chase Tr Unit 1063386
- 0 River Chase Tr Unit 1031259
- 881 River Chase Tr
- 885 River Chase Trail
- 885 Riverchase Trail
- 871 Riverchase Trail
- 0 Riverchase Tr Unit 960020
- 865 River Chase Trail
- 865 Riverchase Trail
- 863 Riverchase Trail
- 888 Riverchase Trail
- 897 Riverchase Trail
- 897 River Chase Trail
- 856 River Chase Trail
- 856 Riverchase Trail
- 844 River Chase Trail