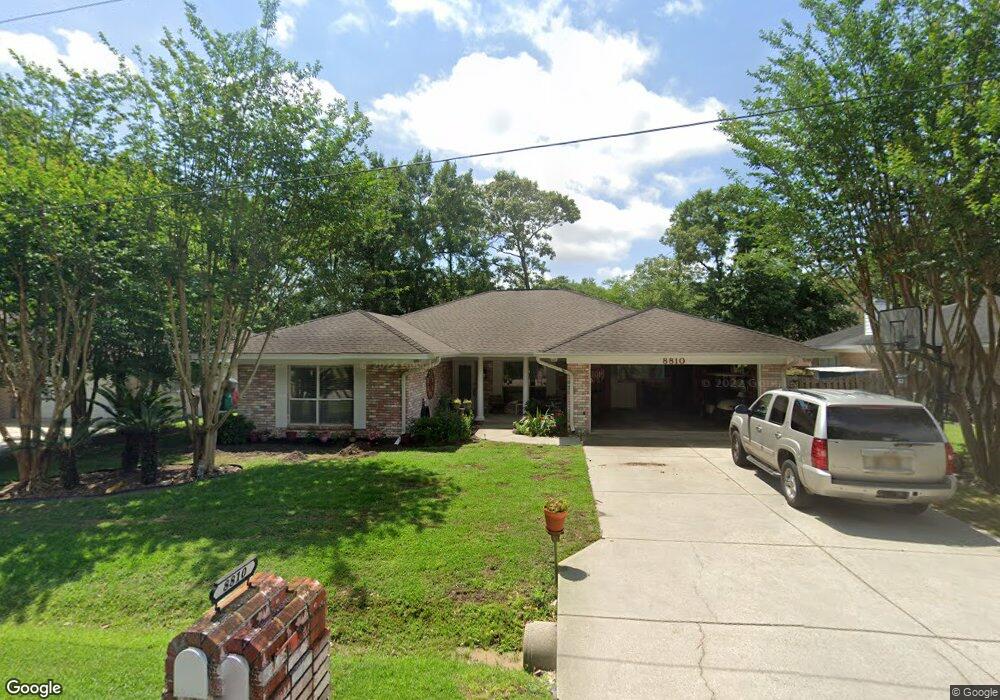
8810 Manoo Place Diamondhead, MS 39525
Estimated Value: $243,000 - $289,000
3
Beds
1
Bath
2,609
Sq Ft
$105/Sq Ft
Est. Value
About This Home
This home is located at 8810 Manoo Place, Diamondhead, MS 39525 and is currently estimated at $272,825, approximately $104 per square foot. 8810 Manoo Place is a home located in Hancock County with nearby schools including East Hancock Elementary School, Hancock Middle School, and Hancock High School.
Ownership History
Date
Name
Owned For
Owner Type
Purchase Details
Closed on
Oct 28, 2021
Sold by
Diamondhead Country Club And Property Ow
Bought by
Krula Joseph and Krula Patricia
Current Estimated Value
Purchase Details
Closed on
Jun 11, 2021
Sold by
Fortenberry Melvin E and Fortenberry Mary
Bought by
Krula Joseph James and Krula Patricia Lynn
Purchase Details
Closed on
May 28, 2021
Sold by
Fortenberry Melvin E and Ladner Kendall Ray
Bought by
Fortenberry Melvin E and Fortenberry Mary
Purchase Details
Closed on
May 12, 2021
Sold by
Sessions Taren Anne
Bought by
Luebbe Ethel F
Purchase Details
Closed on
Jul 20, 2017
Sold by
Ohanlon Thomas C and Hanlon Sarah P O
Bought by
Hanlan Thomas C O and Hanlan Sarah P O
Purchase Details
Closed on
Sep 26, 2011
Sold by
Mckeon Timothy J and Mckeon Catherine T
Bought by
O'Hanlon Thomas C and O'Hanlon Sarah P
Create a Home Valuation Report for This Property
The Home Valuation Report is an in-depth analysis detailing your home's value as well as a comparison with similar homes in the area
Home Values in the Area
Average Home Value in this Area
Purchase History
| Date | Buyer | Sale Price | Title Company |
|---|---|---|---|
| Krula Joseph | -- | Reso Melissa Nunley | |
| Krula Joseph | -- | Reso Melissa Nunley | |
| Krula Joseph James | -- | None Available | |
| Fortenberry Melvin E | -- | None Available | |
| Luebbe Ethel F | -- | None Available | |
| Hanlan Thomas C O | -- | -- | |
| O'Hanlon Thomas C | -- | -- |
Source: Public Records
Tax History
| Year | Tax Paid | Tax Assessment Tax Assessment Total Assessment is a certain percentage of the fair market value that is determined by local assessors to be the total taxable value of land and additions on the property. | Land | Improvement |
|---|---|---|---|---|
| 2025 | $1,997 | $16,013 | $1,200 | $14,813 |
| 2024 | $1,997 | $16,013 | $1,200 | $14,813 |
| 2023 | $1,997 | $16,013 | $1,200 | $14,813 |
| 2022 | $1,062 | $16,013 | $1,200 | $14,813 |
| 2021 | $1,062 | $16,013 | $1,200 | $14,813 |
| 2020 | $1,090 | $16,013 | $1,200 | $14,813 |
| 2019 | $1,128 | $16,013 | $1,200 | $14,813 |
| 2018 | $1,128 | $16,013 | $1,200 | $14,813 |
| 2017 | $1,128 | $16,013 | $1,200 | $14,813 |
| 2016 | $1,107 | $16,013 | $1,200 | $14,813 |
| 2015 | $897 | $14,667 | $1,200 | $13,467 |
| 2014 | $972 | $15,387 | $1,200 | $14,187 |
| 2013 | $946 | $15,387 | $1,200 | $14,187 |
Source: Public Records
Map
Nearby Homes
- 8828 Manoo Place
- 8820 Manoo Place
- 882 Maili Place
- 8824 Kipapa Way
- 8834 Kipapa Way
- 8820 Kailua Place
- 9827 Ana Hulu St
- 88154 Golf Club Dr
- 796 Hapuna Place
- 992 Halawa Ct
- 8921 Hanalei Cir
- 99118 Koloa St
- 87001 Beaux Vue Ct
- 7928 Hapuna Place
- 9844 Kaimuki Ct
- 7881 Hilo Way
- 9823 Ala Moana St
- 0 Golf Club Dr Unit 4127888
- 0 Golf Club Dr Unit 4133960
- 79322 E Diamondhead Dr
- 8810 Manoo Place
- 8812 Manoo St
- 8812 Manoo Place
- 888 Manoo Place
- 88374 Diamondhead Dr E
- 88378 Diamondhead Dr E
- 886 Manoo Place
- 8824 Manoo Place
- 88372 Diamondhead Dr E
- 8816 Manoo Place
- 8822 Manoo Place
- 884 Manoo Place
- 88380 E Diamondhead Dr
- 8830 Manoo Place
- 8818 Maili Place
- 8816 Maili Place
- 8832 Manoo Place
- 88382 Diamondhead Dr E
- 882 Oio St
- 88375 Diamondhead Dr E
Your Personal Tour Guide
Ask me questions while you tour the home.