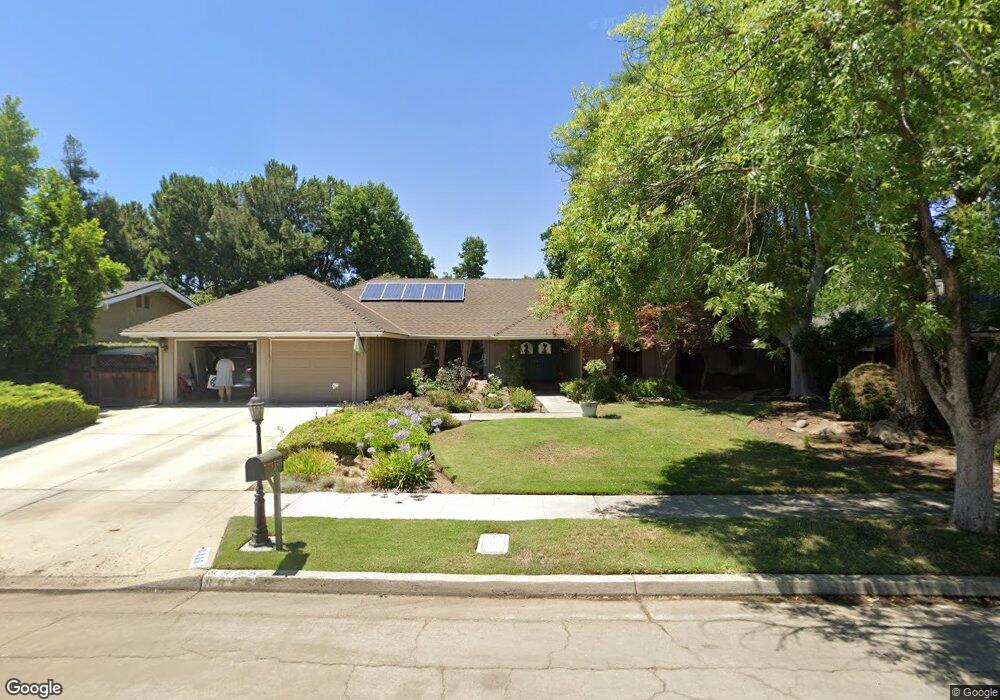
8815 N Eureka Ave Fresno, CA 93720
Woodward Park NeighborhoodEstimated Value: $618,913 - $719,000
4
Beds
2
Baths
2,248
Sq Ft
$296/Sq Ft
Est. Value
About This Home
This home is located at 8815 N Eureka Ave, Fresno, CA 93720 and is currently estimated at $666,478, approximately $296 per square foot. 8815 N Eureka Ave is a home located in Fresno County with nearby schools including Fort Washington Elementary School, Kastner Intermediate School, and Clovis West High School.
Ownership History
Date
Name
Owned For
Owner Type
Purchase Details
Closed on
Nov 9, 2018
Sold by
Johnson Randol D
Bought by
Johnson Randol D and Johnson Kelly A
Current Estimated Value
Home Financials for this Owner
Home Financials are based on the most recent Mortgage that was taken out on this home.
Original Mortgage
$406,746
Outstanding Balance
$356,920
Interest Rate
4.7%
Mortgage Type
VA
Estimated Equity
$309,558
Purchase Details
Closed on
Jun 4, 2002
Sold by
Dority Scott and Dority Kim
Bought by
Johnson Randol D
Home Financials for this Owner
Home Financials are based on the most recent Mortgage that was taken out on this home.
Original Mortgage
$273,550
Interest Rate
6.7%
Purchase Details
Closed on
Sep 29, 1994
Sold by
Rendino Judith Ann
Bought by
Dority Scott and Dority Kim
Home Financials for this Owner
Home Financials are based on the most recent Mortgage that was taken out on this home.
Original Mortgage
$162,000
Interest Rate
8.54%
Create a Home Valuation Report for This Property
The Home Valuation Report is an in-depth analysis detailing your home's value as well as a comparison with similar homes in the area
Home Values in the Area
Average Home Value in this Area
Purchase History
| Date | Buyer | Sale Price | Title Company |
|---|---|---|---|
| Johnson Randol D | -- | Solidifi Title | |
| Johnson Randol D | $304,000 | First American Title Ins Co | |
| Dority Scott | $180,000 | American Title Co |
Source: Public Records
Mortgage History
| Date | Status | Borrower | Loan Amount |
|---|---|---|---|
| Open | Johnson Randol D | $406,746 | |
| Previous Owner | Johnson Randol D | $273,550 | |
| Previous Owner | Dority Scott | $162,000 |
Source: Public Records
Tax History Compared to Growth
Tax History
| Year | Tax Paid | Tax Assessment Tax Assessment Total Assessment is a certain percentage of the fair market value that is determined by local assessors to be the total taxable value of land and additions on the property. | Land | Improvement |
|---|---|---|---|---|
| 2025 | $4,910 | $412,759 | $94,132 | $318,627 |
| 2023 | $4,816 | $396,733 | $90,478 | $306,255 |
| 2022 | $4,751 | $388,954 | $88,704 | $300,250 |
| 2021 | $4,619 | $381,328 | $86,965 | $294,363 |
| 2020 | $4,600 | $377,419 | $86,074 | $291,345 |
| 2019 | $4,511 | $370,020 | $84,387 | $285,633 |
| 2018 | $9,377 | $362,766 | $82,733 | $280,033 |
| 2017 | $9,282 | $355,654 | $81,111 | $274,543 |
| 2016 | $10,666 | $348,681 | $79,521 | $269,160 |
| 2015 | $4,128 | $343,444 | $78,327 | $265,117 |
| 2014 | $4,051 | $336,717 | $76,793 | $259,924 |
Source: Public Records
Map
Nearby Homes
- 264 E Loyola Ave
- 316 E Lester Ave
- 355 E Everglade Ave
- 343 E Deer Creek Ln
- 241 E Cole Ave
- 9260 N Green Meadows Ln
- 9098 N Cherryhill Ln
- 9094 N Cherryhill Ln
- 564 E Braddock Dr
- 9161 N Woodlawn Dr
- 8615 N Bond St
- 790 E Serena Ave
- 513 E Portland Ave
- 9109 N Chadwick Ln
- 8892 N 5th St
- 8052 N Mariposa St
- 218 W Hubert Ct
- 9360 N 9360 N Blackstone Ave Unit 201
- 242 W Hubert Ct
- 9360 N Blackstone Ave Unit 116
- 8799 N Eureka Ave
- 8837 N Eureka Ave
- 8787 N Eureka Ave
- 249 E Lester Ave
- 256 E Everglade Ave
- 226 E Loyola Ave
- 260 E Everglade Ave
- 8775 N Eureka Ave
- 261 E Lester Ave
- 255 E Everglade Ave
- 238 E Loyola Ave
- 271 E Everglade Ave
- 8772 N Eureka Ave
- 277 E Lester Ave
- 8763 N Eureka Ave
- 264 E Everglade Ave
- 250 E Loyola Ave
- 294 E Lester Ave
- 274 E Everglade Ave
- 268 E Everglade Ave