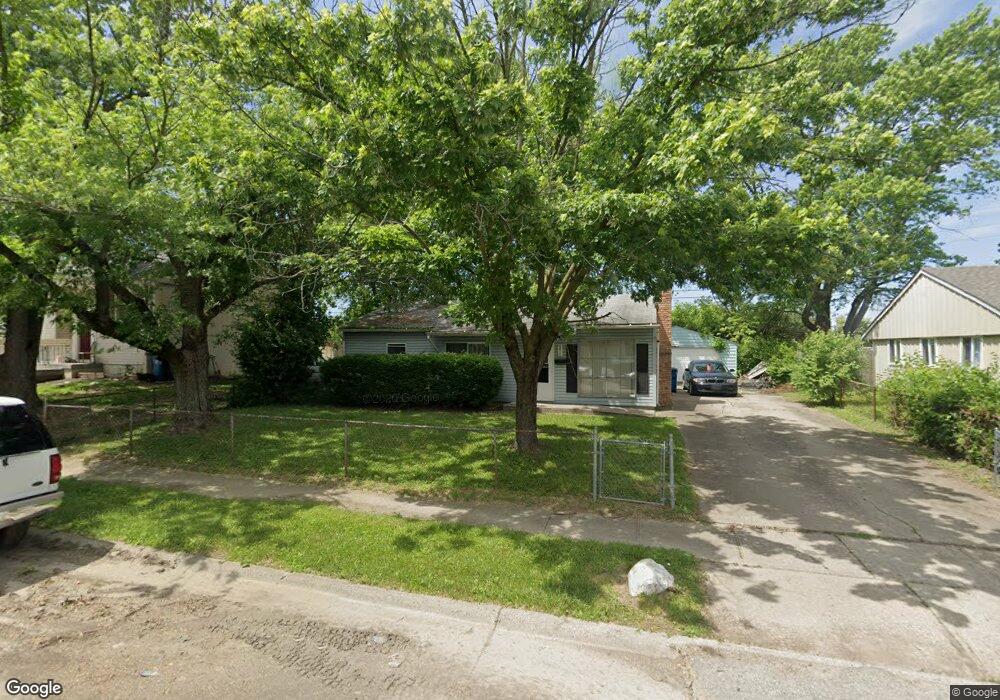
8816 E 41st Place Indianapolis, IN 46226
Far Eastside NeighborhoodEstimated Value: $94,000 - $148,000
2
Beds
1
Bath
925
Sq Ft
$141/Sq Ft
Est. Value
About This Home
This home is located at 8816 E 41st Place, Indianapolis, IN 46226 and is currently estimated at $130,535, approximately $141 per square foot. 8816 E 41st Place is a home located in Marion County with nearby schools including Robert Lee Frost School 106, James Whitcomb Riley School 43, and Charles Warren Fairbanks School 105.
Ownership History
Date
Name
Owned For
Owner Type
Purchase Details
Closed on
Feb 11, 2022
Sold by
Fwe Llc
Bought by
Vb One Llc
Current Estimated Value
Purchase Details
Closed on
Feb 8, 2022
Sold by
Fwe Llc
Bought by
Vb One Llc
Purchase Details
Closed on
Apr 28, 2014
Sold by
Allen Pamela T
Bought by
Nakulski William
Purchase Details
Closed on
Apr 25, 2014
Sold by
Allen Pamela T
Bought by
Fwe Llc
Purchase Details
Closed on
Dec 29, 2010
Sold by
United Capital Rentals Llc
Bought by
Allen Pamela T
Purchase Details
Closed on
Dec 14, 2010
Sold by
A & P Investments
Bought by
United Capital Rentals Llc
Purchase Details
Closed on
Nov 11, 2010
Sold by
Bmcc Llc
Bought by
A & P Investments
Purchase Details
Closed on
Jun 30, 2010
Sold by
Pnc Bank N A
Bought by
Bmcc Llc
Purchase Details
Closed on
Apr 8, 2010
Sold by
The Unknown Heirs At Law Of Robert P Sch
Bought by
Pnc Bank Na
Create a Home Valuation Report for This Property
The Home Valuation Report is an in-depth analysis detailing your home's value as well as a comparison with similar homes in the area
Home Values in the Area
Average Home Value in this Area
Purchase History
| Date | Buyer | Sale Price | Title Company |
|---|---|---|---|
| Vb One Llc | -- | Total Title | |
| Vb One Llc | $96,500 | Total Title | |
| Nakulski William | $28,000 | Investor Closing Services Ll | |
| Fwe Llc | -- | None Available | |
| Allen Pamela T | -- | None Available | |
| United Capital Rentals Llc | -- | None Available | |
| A & P Investments | -- | None Available | |
| Bmcc Llc | -- | None Available | |
| Pnc Bank Na | $21,000 | None Available |
Source: Public Records
Tax History
| Year | Tax Paid | Tax Assessment Tax Assessment Total Assessment is a certain percentage of the fair market value that is determined by local assessors to be the total taxable value of land and additions on the property. | Land | Improvement |
|---|---|---|---|---|
| 2024 | $2,118 | $92,100 | $8,800 | $83,300 |
| 2023 | $2,118 | $84,800 | $8,800 | $76,000 |
| 2022 | $1,898 | $76,000 | $8,800 | $67,200 |
| 2021 | $1,525 | $61,700 | $8,800 | $52,900 |
| 2020 | $1,398 | $56,100 | $3,700 | $52,400 |
| 2019 | $1,372 | $54,000 | $3,700 | $50,300 |
| 2018 | $1,336 | $52,100 | $3,700 | $48,400 |
| 2017 | $1,168 | $50,700 | $3,700 | $47,000 |
| 2016 | $1,253 | $49,200 | $3,700 | $45,500 |
| 2014 | $1,057 | $48,900 | $3,700 | $45,200 |
| 2013 | $1,386 | $48,900 | $3,700 | $45,200 |
Source: Public Records
Map
Nearby Homes
- 4045 N Post Rd
- 8704 Montery Rd
- 3950 Malibu Ct
- 3938 Biscayne Rd
- 3976 Marseille Rd
- 8445 Montery Rd
- 8610 Meadowlark Dr
- 3957 Richelieu Rd
- 4040 Aspen Way
- 8337 Aspen Ct
- 3909 Richelieu Ct
- 8246 E 41st Place
- 4402 Cherry Valley Dr
- 4149 Mellis Dr
- 3904 Ireland Dr
- 3851 Esquire Place
- 3640 Marseille Rd
- 8118 E 45th St
- 9460 Burrwood Cir
- 9643 Pepperidge Dr
- 8822 E 41st Place
- 8810 E 41st Place
- 8810 E 41st Place
- 8828 E 41st Place
- 8804 E 41st Place
- 8815 E 41st Place
- 8809 E 41st Place
- 8821 E 41st Place
- 8744 E 41st Place
- 4156 Biscayne Rd
- 8803 E 41st Place
- 8827 E 41st Place
- 8840 E 42nd St
- 8745 E 41st Place
- 4140 Biscayne Rd
- 8738 E 41st Place
- 8816 Balboa Ct
- 8810 Balboa Ct
- 8737 E 41st Place
- 8804 Balboa Ct
Your Personal Tour Guide
Ask me questions while you tour the home.