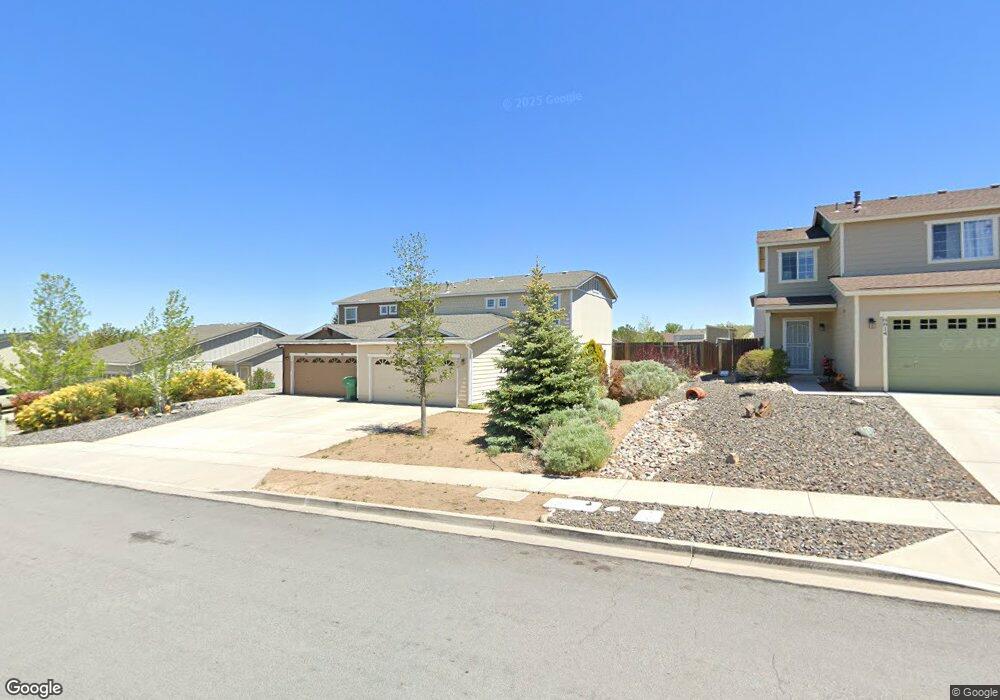
8818 Sunset Breeze Dr Reno, NV 89506
Stead NeighborhoodEstimated Value: $339,000 - $411,000
3
Beds
3
Baths
1,350
Sq Ft
$285/Sq Ft
Est. Value
About This Home
This home is located at 8818 Sunset Breeze Dr, Reno, NV 89506 and is currently estimated at $384,332, approximately $284 per square foot. 8818 Sunset Breeze Dr is a home located in Washoe County with nearby schools including Stokesdale Elementary School, Silver Lake Elementary School, and Glenn C. Marlow Elementary School.
Ownership History
Date
Name
Owned For
Owner Type
Purchase Details
Closed on
Feb 20, 2025
Sold by
Tricon Sfr 2025-1 Equity Owner Llc
Bought by
Tricon Sfr 2025-1 Borrower Llc
Current Estimated Value
Purchase Details
Closed on
May 12, 2015
Sold by
Tah Securitized Rsp Llc
Bought by
Tah 2015 1 Equity Owner Llc
Purchase Details
Closed on
Jul 17, 2013
Sold by
National Default Servicing Corp
Bought by
Mckinley Holding 1 Lp
Purchase Details
Closed on
Mar 23, 2005
Sold by
Centex Homes
Bought by
Bylsma Bryan E and Bylsma Laura
Home Financials for this Owner
Home Financials are based on the most recent Mortgage that was taken out on this home.
Original Mortgage
$192,647
Interest Rate
5.53%
Mortgage Type
FHA
Create a Home Valuation Report for This Property
The Home Valuation Report is an in-depth analysis detailing your home's value as well as a comparison with similar homes in the area
Home Values in the Area
Average Home Value in this Area
Purchase History
| Date | Buyer | Sale Price | Title Company |
|---|---|---|---|
| Tricon Sfr 2025-1 Borrower Llc | -- | Os National | |
| Tah 2015 1 Equity Owner Llc | -- | None Available | |
| Tah Securitized Rsp Llc | -- | None Available | |
| Mickinley Equity Lp | -- | None Available | |
| Mckinley Holding 1 Lp | $111,000 | None Available | |
| Bylsma Bryan E | $196,000 | Commerce Title Company |
Source: Public Records
Mortgage History
| Date | Status | Borrower | Loan Amount |
|---|---|---|---|
| Previous Owner | Bylsma Bryan E | $192,647 |
Source: Public Records
Tax History Compared to Growth
Tax History
| Year | Tax Paid | Tax Assessment Tax Assessment Total Assessment is a certain percentage of the fair market value that is determined by local assessors to be the total taxable value of land and additions on the property. | Land | Improvement |
|---|---|---|---|---|
| 2026 | $1,305 | $73,871 | $26,250 | $47,621 |
| 2025 | $1,616 | $74,365 | $26,600 | $47,765 |
| 2024 | $1,498 | $72,285 | $22,960 | $49,325 |
| 2023 | $1,498 | $68,260 | $24,885 | $43,375 |
| 2022 | $1,387 | $58,049 | $20,545 | $37,504 |
| 2021 | $1,284 | $53,593 | $16,065 | $37,528 |
| 2020 | $1,208 | $54,160 | $16,450 | $37,710 |
| 2019 | $1,151 | $52,605 | $15,890 | $36,715 |
| 2018 | $1,098 | $46,549 | $10,640 | $35,909 |
| 2017 | $1,055 | $45,793 | $10,185 | $35,608 |
| 2016 | $1,028 | $44,788 | $8,715 | $36,073 |
| 2015 | $1,025 | $44,608 | $7,875 | $36,733 |
| 2014 | $994 | $33,242 | $5,145 | $28,097 |
| 2013 | -- | $26,476 | $4,095 | $22,381 |
Source: Public Records
Map
Nearby Homes
- 8660 Sunrise Mist Ct
- 8678 Strutter Way
- 8602 Strutter Way
- 8696 Red Baron Blvd
- 7497 Hebrides Ct
- 7663 Crystal Shores Dr
- 7447 Findhorn Dr
- 7462 Findhorn Dr
- 8486 Piper Place
- 8410 Red Baron Blvd
- 7085 Indigo Cir
- 8419 Sopwith Blvd
- 11642 Green Mountain St
- 12123 Andes St
- 6995 Peppermint Dr
- 12360 Rocky Mountain St
- 8031 Monterey Shores Dr
- 6769 Peppermint Ct
- 12190 Rocky Mountain St
- 6521 Flower St
- 8814 Sunset Breeze Dr
- 8822 Sunset Breeze Dr
- 8810 Sunset Breeze Dr
- 8826 Sunset Breeze Dr
- 8903 Red Baron Blvd
- 8907 Red Baron Blvd
- 8899 Red Baron Blvd
- 8817 Sunset Breeze Dr
- 8821 Sunset Breeze Dr
- 8794 Sunset Breeze Dr
- 8895 Red Baron Blvd
- 8911 Red Baron Blvd
- 8916 Red Baron Blvd
- 8825 Sunset Breeze Dr
- 8915 Red Baron Blvd
- 8891 Red Baron Blvd
- 8908 Red Baron Blvd
- 8912 Red Baron Blvd
- 8790 Sunset Breeze Dr
- 8898 Red Baron Blvd