Estimated Value: $485,000 - $516,000
3
Beds
2
Baths
1,575
Sq Ft
$318/Sq Ft
Est. Value
About This Home
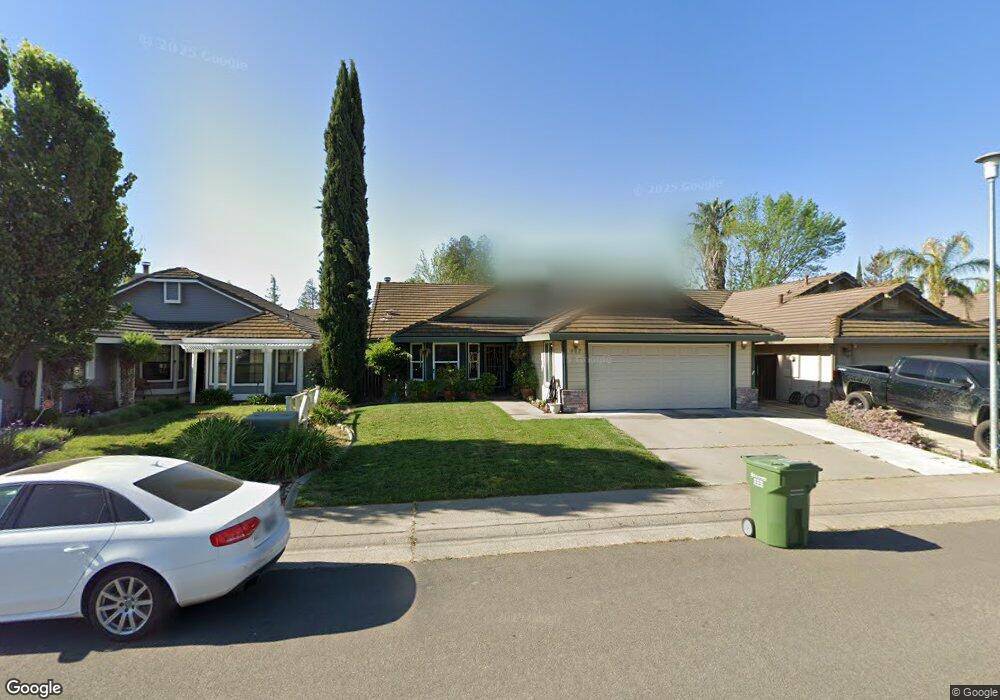
This home is located at 882 Cedar Canyon Cir, Galt, CA 95632 and is currently estimated at $500,115, approximately $317 per square foot. 882 Cedar Canyon Cir is a home located in Sacramento County with nearby schools including Lake Canyon Elementary School, Robert L. McCaffrey Middle School, and Liberty Ranch High School.
Ownership History
Date
Name
Owned For
Owner Type
Purchase Details
Closed on
Aug 31, 2001
Sold by
Furey Gregory J and Furey Mabel Lew
Bought by
Cruz John D and Cruz Susy S
Current Estimated Value
Home Financials for this Owner
Home Financials are based on the most recent Mortgage that was taken out on this home.
Original Mortgage
$175,520
Outstanding Balance
$68,942
Interest Rate
7.09%
Mortgage Type
FHA
Estimated Equity
$431,173
Purchase Details
Closed on
Aug 23, 2001
Sold by
Va
Bought by
Furey Gregory J and Furey Mabel Lew
Home Financials for this Owner
Home Financials are based on the most recent Mortgage that was taken out on this home.
Original Mortgage
$175,520
Outstanding Balance
$68,942
Interest Rate
7.09%
Mortgage Type
FHA
Estimated Equity
$431,173
Purchase Details
Closed on
Feb 6, 1995
Sold by
Bennett & Compton Inc
Bought by
Va
Create a Home Valuation Report for This Property
The Home Valuation Report is an in-depth analysis detailing your home's value as well as a comparison with similar homes in the area
Home Values in the Area
Average Home Value in this Area
Purchase History
| Date | Buyer | Sale Price | Title Company |
|---|---|---|---|
| Cruz John D | $178,000 | Financial Title Company | |
| Furey Gregory J | -- | Financial Title Company | |
| Va | -- | Chicago Title Company | |
| Bennett & Compton Inc | -- | Chicago Title Company |
Source: Public Records
Mortgage History
| Date | Status | Borrower | Loan Amount |
|---|---|---|---|
| Open | Cruz John D | $175,520 |
Source: Public Records
Tax History Compared to Growth
Tax History
| Year | Tax Paid | Tax Assessment Tax Assessment Total Assessment is a certain percentage of the fair market value that is determined by local assessors to be the total taxable value of land and additions on the property. | Land | Improvement |
|---|---|---|---|---|
| 2025 | $2,976 | $268,626 | $73,854 | $194,772 |
| 2024 | $2,976 | $263,359 | $72,406 | $190,953 |
| 2023 | $3,290 | $258,196 | $70,987 | $187,209 |
| 2022 | $3,174 | $253,135 | $69,596 | $183,539 |
| 2021 | $3,176 | $248,173 | $68,232 | $179,941 |
| 2020 | $3,152 | $245,629 | $67,533 | $178,096 |
| 2019 | $3,084 | $240,813 | $66,209 | $174,604 |
| 2018 | $3,079 | $236,092 | $64,911 | $171,181 |
| 2017 | $2,919 | $226,562 | $63,639 | $162,923 |
| 2016 | $2,837 | $222,121 | $62,392 | $159,729 |
| 2015 | $2,981 | $218,785 | $61,455 | $157,330 |
| 2014 | $2,983 | $214,501 | $60,252 | $154,249 |
Source: Public Records
Map
Nearby Homes
- 908 Wildbrook Ct
- 866 Golden Heights Dr
- 1054 Starbrook Dr
- 1156 Monique St
- 1160 Monique St
- Residence 1883 Plan at The Cottages at Greenwood
- 2012 Seraphina St
- Residence 2448 Plan at Summerfield - Cedar Grove at Summerfield
- Residence 2760 Plan at Summerfield - Cedar Glen at Summerfield
- 1173 Monique St
- Residence 3308 Plan at Summerfield - Cedar Glen at Summerfield
- 1164 Monique St
- Residence 2072 Plan at The Towns at Greenwood
- Residence 2788 Plan at Summerfield - Cedar Glen at Summerfield
- 1169 Monique St
- 2016 Seraphina St
- Residence 1894 Plan at The Towns at Greenwood
- Residence 2018 Plan at Summerfield - Cedar Grove at Summerfield
- Residence 2203 Plan at Summerfield - Cedar Grove at Summerfield
- 2020 Seraphina St
- 886 Cedar Canyon Cir
- 878 Cedar Canyon Cir
- 890 Cedar Canyon Cir
- 874 Cedar Canyon Cir
- 999 Doradell Ct
- 881 Black Canyon Ct
- 994 Rossburn Ct
- 894 Cedar Canyon Cir
- 993 Doradell Ct
- 870 Cedar Canyon Cir
- 988 Rossburn Ct
- 987 Doradell Ct
- 866 Cedar Canyon Cir
- 877 Cedar Canyon Cir
- 885 Black Canyon Ct
- 999 Rossburn Ct
- 873 Cedar Canyon Cir
- 901 Black Canyon Ct
- 902 Cedar Canyon Cir
- 981 Doradell Ct