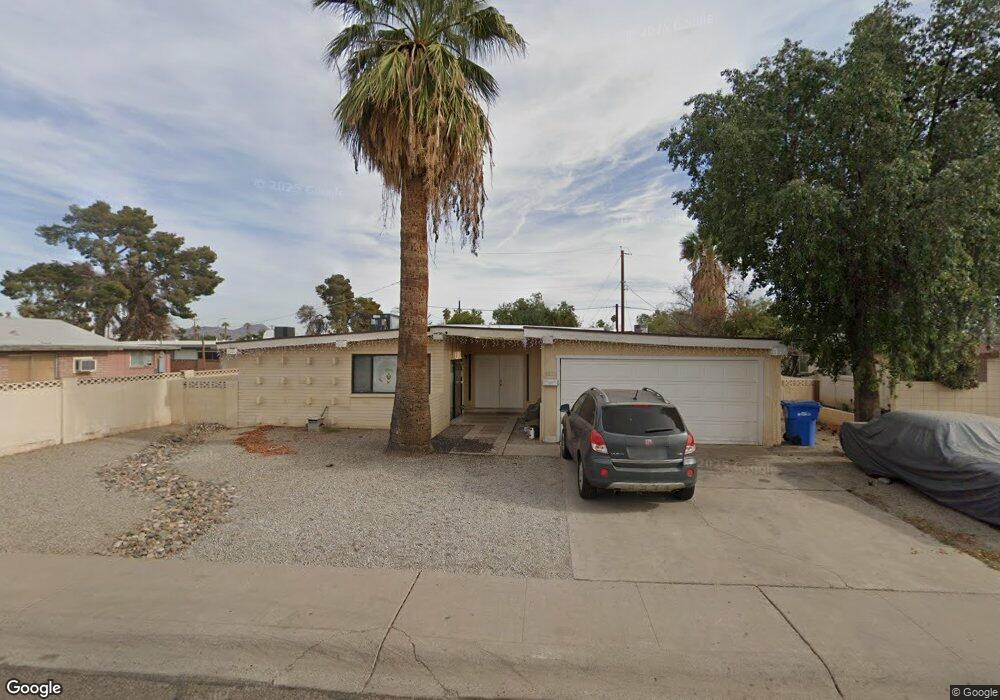
8823 N 38th Dr Phoenix, AZ 85051
North Mountain Village NeighborhoodEstimated Value: $358,434 - $393,000
4
Beds
2
Baths
1,740
Sq Ft
$220/Sq Ft
Est. Value
About This Home
This home is located at 8823 N 38th Dr, Phoenix, AZ 85051 and is currently estimated at $382,609, approximately $219 per square foot. 8823 N 38th Dr is a home located in Maricopa County with nearby schools including Manzanita Elementary School, Palo Verde Middle School, and Cortez High School.
Ownership History
Date
Name
Owned For
Owner Type
Purchase Details
Closed on
Mar 28, 2013
Sold by
Csk Investments Llc
Bought by
Ih2 Property Phoenix Lp
Current Estimated Value
Purchase Details
Closed on
Jul 13, 2009
Sold by
Ryan Keith
Bought by
Csk Investments Llc
Purchase Details
Closed on
Jun 26, 2009
Sold by
Deutsche Bank National Trust
Bought by
Ryan Keith
Purchase Details
Closed on
Aug 8, 2008
Sold by
Hidalgo Guadalupe
Bought by
Deutsche Bank National Trust Co and Terwin Mortgage Trust 2007-4He Asset Bac
Purchase Details
Closed on
Sep 17, 2007
Sold by
Hidalgo Guadalupe
Bought by
Hidalgo Rosalba Garica
Purchase Details
Closed on
Mar 17, 2004
Sold by
Sinanovic Steven M and Sinanovic Loretta A
Bought by
Hidalgo Guadalupe
Home Financials for this Owner
Home Financials are based on the most recent Mortgage that was taken out on this home.
Original Mortgage
$115,900
Interest Rate
6.95%
Mortgage Type
New Conventional
Create a Home Valuation Report for This Property
The Home Valuation Report is an in-depth analysis detailing your home's value as well as a comparison with similar homes in the area
Home Values in the Area
Average Home Value in this Area
Purchase History
| Date | Buyer | Sale Price | Title Company |
|---|---|---|---|
| Ih2 Property Phoenix Lp | $139,250 | Clear Title Agency Of Arizon | |
| Csk Investments Llc | -- | Accommodation | |
| Ryan Keith | $64,900 | First American Title Ins Co | |
| Deutsche Bank National Trust Co | $137,908 | None Available | |
| Hidalgo Rosalba Garica | -- | None Available | |
| Hidalgo Guadalupe | $121,650 | Stewart Title & Trust |
Source: Public Records
Mortgage History
| Date | Status | Borrower | Loan Amount |
|---|---|---|---|
| Previous Owner | Hidalgo Guadalupe | $115,900 |
Source: Public Records
Tax History Compared to Growth
Tax History
| Year | Tax Paid | Tax Assessment Tax Assessment Total Assessment is a certain percentage of the fair market value that is determined by local assessors to be the total taxable value of land and additions on the property. | Land | Improvement |
|---|---|---|---|---|
| 2025 | $1,358 | $10,686 | -- | -- |
| 2024 | $1,283 | $10,177 | -- | -- |
| 2023 | $1,283 | $27,060 | $5,410 | $21,650 |
| 2022 | $1,241 | $20,730 | $4,140 | $16,590 |
| 2021 | $1,257 | $18,960 | $3,790 | $15,170 |
| 2020 | $1,226 | $17,610 | $3,520 | $14,090 |
| 2019 | $1,204 | $15,530 | $3,100 | $12,430 |
| 2018 | $1,172 | $14,400 | $2,880 | $11,520 |
| 2017 | $1,166 | $13,060 | $2,610 | $10,450 |
| 2016 | $1,145 | $12,350 | $2,470 | $9,880 |
| 2015 | $1,060 | $11,980 | $2,390 | $9,590 |
Source: Public Records
Map
Nearby Homes
- 3718 W Puget Ave
- 9034 N 38th Dr
- 3639 W Lawrence Ln
- 3554 W Townley Ave
- 3741 W Davidson Ln
- 3718 W Diana Ave
- 8514 N 38th Dr Unit 3
- 3812 W Seldon Ln
- 9225 N 40th Dr
- 9227 N 36th Dr
- 4218 W Lawrence Ln
- 3501 W Diana Ave
- 9222 N 35th Ave Unit 11
- 9222 N 35th Ave Unit 1
- 3636 W Echo Ln
- 4141 W Diana Ave
- 3701 W Echo Ln Unit 4
- 3510 W Seldon Ln
- 4232 W Ruth Ave
- 8801 N 34th Ave
- 8823 N 38th Dr
- 8819 N 38th Dr
- 3825 W Puget Ave
- 3819 W Puget Ave
- 8811 N 38th Dr
- 3802 W Golden Ln
- 3806 W Golden Ln
- 8828 N 38th Dr
- 3813 W Puget Ave
- 8818 N 38th Dr
- 8834 N 38th Dr
- 8812 N 38th Dr
- 3807 W Puget Ave
- 3810 W Golden Ln
- 3814 W Golden Ln
- 8840 N 38th Dr
- 3820 W Puget Ave
- 3820 W Golden Ln
- 3742 W Golden Ln
- 3814 W Puget Ave