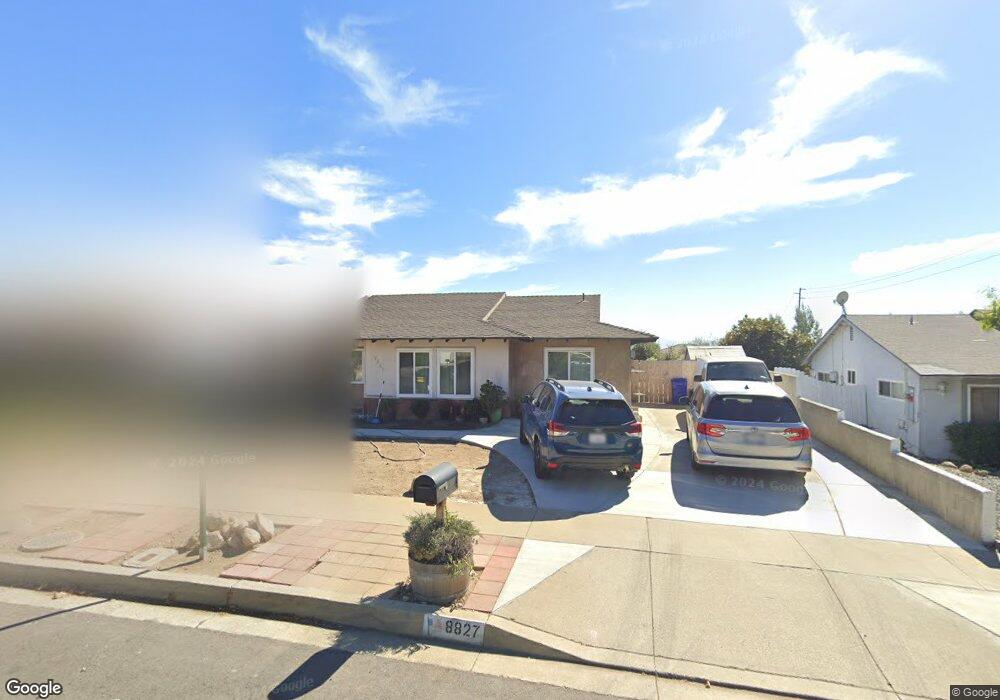
8827 Hemlock St Rancho Cucamonga, CA 91730
Estimated Value: $670,219 - $719,000
4
Beds
2
Baths
1,470
Sq Ft
$477/Sq Ft
Est. Value
About This Home
This home is located at 8827 Hemlock St, Rancho Cucamonga, CA 91730 and is currently estimated at $701,055, approximately $476 per square foot. 8827 Hemlock St is a home located in San Bernardino County with nearby schools including Valle Vista Elementary, Cucamonga Middle, and Alta Loma High.
Ownership History
Date
Name
Owned For
Owner Type
Purchase Details
Closed on
Jan 27, 2009
Sold by
The Bank Of New York
Bought by
Hoth Dennis and Hoth Sonia
Current Estimated Value
Home Financials for this Owner
Home Financials are based on the most recent Mortgage that was taken out on this home.
Original Mortgage
$242,526
Outstanding Balance
$153,142
Interest Rate
5.08%
Mortgage Type
FHA
Estimated Equity
$547,913
Purchase Details
Closed on
Dec 2, 2008
Sold by
Tuttle Robert S
Bought by
The Bank Of New York
Home Financials for this Owner
Home Financials are based on the most recent Mortgage that was taken out on this home.
Original Mortgage
$242,526
Outstanding Balance
$153,142
Interest Rate
5.08%
Mortgage Type
FHA
Estimated Equity
$547,913
Purchase Details
Closed on
Jun 12, 2000
Sold by
Strickland Richard P
Bought by
Tuttle Robert S and Tuttle Cynthia M
Home Financials for this Owner
Home Financials are based on the most recent Mortgage that was taken out on this home.
Original Mortgage
$163,601
Interest Rate
8.2%
Mortgage Type
FHA
Create a Home Valuation Report for This Property
The Home Valuation Report is an in-depth analysis detailing your home's value as well as a comparison with similar homes in the area
Home Values in the Area
Average Home Value in this Area
Purchase History
| Date | Buyer | Sale Price | Title Company |
|---|---|---|---|
| Hoth Dennis | $247,000 | Lsi Title Agency | |
| The Bank Of New York | $220,000 | None Available | |
| Tuttle Robert S | $165,000 | Fidelity National Title Ins |
Source: Public Records
Mortgage History
| Date | Status | Borrower | Loan Amount |
|---|---|---|---|
| Open | Hoth Dennis | $242,526 | |
| Previous Owner | Tuttle Robert S | $163,601 |
Source: Public Records
Tax History Compared to Growth
Tax History
| Year | Tax Paid | Tax Assessment Tax Assessment Total Assessment is a certain percentage of the fair market value that is determined by local assessors to be the total taxable value of land and additions on the property. | Land | Improvement |
|---|---|---|---|---|
| 2025 | $3,396 | $318,081 | $112,038 | $206,043 |
| 2024 | $3,396 | $311,844 | $109,841 | $202,003 |
| 2023 | $3,322 | $305,729 | $107,687 | $198,042 |
| 2022 | $3,267 | $299,734 | $105,575 | $194,159 |
| 2021 | $3,265 | $293,857 | $103,505 | $190,352 |
| 2020 | $3,172 | $290,844 | $102,444 | $188,400 |
| 2019 | $3,155 | $285,141 | $100,435 | $184,706 |
| 2018 | $3,066 | $279,550 | $98,466 | $181,084 |
| 2017 | $3,009 | $274,068 | $96,535 | $177,533 |
| 2016 | $2,972 | $268,694 | $94,642 | $174,052 |
| 2015 | $2,940 | $264,658 | $93,220 | $171,438 |
| 2014 | $2,853 | $259,474 | $91,394 | $168,080 |
Source: Public Records
Map
Nearby Homes
- 0 Camino Predera Unit OC25188933
- 0 Camino Predera Unit WS25184133
- 8091 Camino Predera
- 7719 Vineyard Ave
- 8167 Vineyard Ave Unit 23
- 8167 Vineyard Ave Unit 38
- 8167 Vineyard Ave Unit 109
- 7906 Montara Ave
- 8976 Yew St
- 8651 Foothill Blvd Unit 63
- 8651 Foothill Blvd Unit 18
- 8651 Foothill Blvd Unit 46
- 8651 Foothill Blvd Unit 99
- 8651 Foothill Blvd Unit 42
- 8525 Calle Carabe St Unit 45
- 8305 Highridge Place
- 8814 Knollwood Place
- 8321 Vineyard Ave Unit 5
- 8333 Vineyard Ave Unit 4
- 9340 Foothill Blvd Unit 68
- 8819 Hemlock St
- 8837 Hemlock St
- 8843 Hemlock St
- 8830 Hemlock St
- 8844 Hemlock St
- 8818 Hemlock St
- 8855 Hemlock St
- 8948 Westbrook Ct
- 8810 Hemlock St Unit MUSEUM
- 8949 Westbrook Ct
- 8956 Westbrook Ct
- 8865 Hemlock St
- 8921 Reeves Ct
- 8870 San Bernardino Rd
- 8957 Westbrook Ct
- 8962 Westbrook Ct
- 8940 Reeves Ct
- 7950 Summerlin Place
- 8875 Hemlock St
- 8930 Reeves Ct