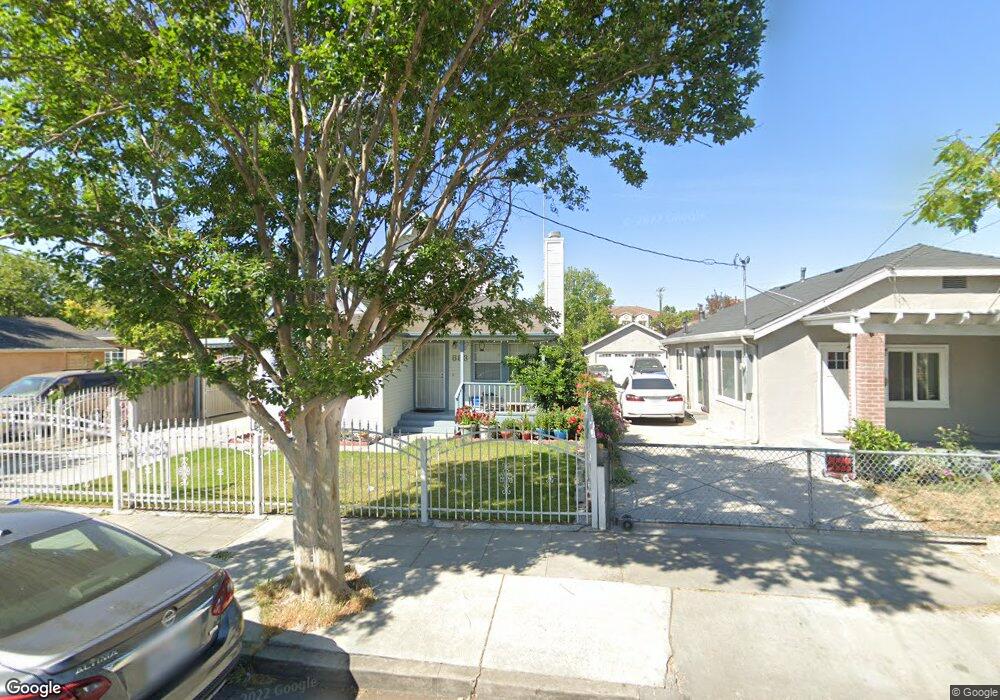
883 N 14th St San Jose, CA 95112
Luna Park NeighborhoodEstimated Value: $1,171,000 - $1,330,000
3
Beds
2
Baths
1,609
Sq Ft
$771/Sq Ft
Est. Value
About This Home
This home is located at 883 N 14th St, San Jose, CA 95112 and is currently estimated at $1,240,139, approximately $770 per square foot. 883 N 14th St is a home located in Santa Clara County with nearby schools including Muwekma Ohlone Middle, San Jose High School, and Ace Inspire Academy.
Ownership History
Date
Name
Owned For
Owner Type
Purchase Details
Closed on
Mar 25, 2019
Sold by
Phan Tho Anh
Bought by
Phan Tho Anh and Thi Mai Hanh Nhan
Current Estimated Value
Purchase Details
Closed on
Jun 22, 1998
Sold by
Phan Tho Anh and Phan Minhtam Thi
Bought by
Phan Tho Anh
Purchase Details
Closed on
Jan 23, 1997
Sold by
Codraro Steven J
Bought by
Phan Tho Anh and Phan Minhtam Thi
Home Financials for this Owner
Home Financials are based on the most recent Mortgage that was taken out on this home.
Original Mortgage
$171,500
Outstanding Balance
$18,603
Interest Rate
7.74%
Estimated Equity
$1,221,536
Create a Home Valuation Report for This Property
The Home Valuation Report is an in-depth analysis detailing your home's value as well as a comparison with similar homes in the area
Home Values in the Area
Average Home Value in this Area
Purchase History
| Date | Buyer | Sale Price | Title Company |
|---|---|---|---|
| Phan Tho Anh | -- | None Available | |
| Phan Tho Anh | -- | -- | |
| Phan Tho Anh | $215,000 | Old Republic Title Company |
Source: Public Records
Mortgage History
| Date | Status | Borrower | Loan Amount |
|---|---|---|---|
| Open | Phan Tho Anh | $171,500 |
Source: Public Records
Tax History Compared to Growth
Tax History
| Year | Tax Paid | Tax Assessment Tax Assessment Total Assessment is a certain percentage of the fair market value that is determined by local assessors to be the total taxable value of land and additions on the property. | Land | Improvement |
|---|---|---|---|---|
| 2025 | $5,900 | $390,400 | $221,536 | $168,864 |
| 2024 | $5,900 | $382,746 | $217,193 | $165,553 |
| 2023 | $5,758 | $375,242 | $212,935 | $162,307 |
| 2022 | $5,707 | $367,885 | $208,760 | $159,125 |
| 2021 | $5,550 | $360,672 | $204,667 | $156,005 |
| 2020 | $5,392 | $356,975 | $202,569 | $154,406 |
| 2019 | $5,259 | $349,977 | $198,598 | $151,379 |
| 2018 | $5,191 | $343,115 | $194,704 | $148,411 |
| 2017 | $5,137 | $336,388 | $190,887 | $145,501 |
| 2016 | $4,984 | $329,794 | $187,145 | $142,649 |
| 2015 | $4,939 | $324,841 | $184,334 | $140,507 |
| 2014 | $4,509 | $318,479 | $180,724 | $137,755 |
Source: Public Records
Map
Nearby Homes
- 622 Berryessa Rd
- 0 E Hedding St
- 818 N 13th St
- 1025 N 12th St
- 863 N 17th St
- 494 Madera Ave
- 775 N 14th St
- 748-3 N 10th St
- 860 N 19th St
- 800 N 8th St Unit 120
- 800 N 8th St Unit 311
- 800 N 8th St Unit 207
- 689 N 16th St
- 350 E Mission St Unit 211
- 350 E Mission St Unit 115
- 682 N 18th St
- 1020 E Mission St
- 448 Jackson St
- 861 N 5th St
- 509 N 9th St Unit 23