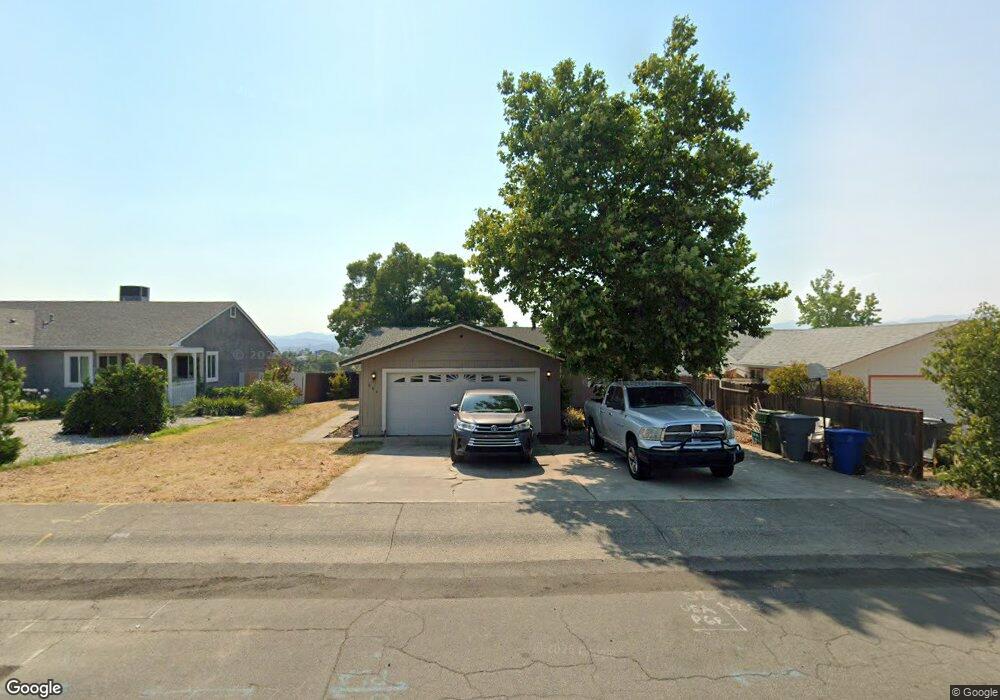
884 Springer Dr Redding, CA 96003
Boulder Creek NeighborhoodEstimated Value: $318,000 - $336,000
3
Beds
2
Baths
1,168
Sq Ft
$280/Sq Ft
Est. Value
About This Home
This home is located at 884 Springer Dr, Redding, CA 96003 and is currently estimated at $326,610, approximately $279 per square foot. 884 Springer Dr is a home located in Shasta County with nearby schools including Boulder Creek Elementary School, Enterprise High School, and Country Christian School.
Ownership History
Date
Name
Owned For
Owner Type
Purchase Details
Closed on
Jan 25, 2010
Sold by
Us Bank Na
Bought by
Power Robert J
Current Estimated Value
Purchase Details
Closed on
Jun 25, 2009
Sold by
Cozzo Jeff Todd and Cozzo Julie Gardner
Bought by
U S Bank Na
Purchase Details
Closed on
Oct 18, 2005
Sold by
Guterding Jay Ernest and Guterding Janaea Patricia
Bought by
Cozzo Jeff Todd and Cozzo Julie Gardner
Home Financials for this Owner
Home Financials are based on the most recent Mortgage that was taken out on this home.
Original Mortgage
$220,250
Interest Rate
5.67%
Mortgage Type
Fannie Mae Freddie Mac
Purchase Details
Closed on
Aug 28, 2002
Sold by
Guterding Jay Ernest
Bought by
Guterding Jay Ernest and Guterding Janaea Patricia
Home Financials for this Owner
Home Financials are based on the most recent Mortgage that was taken out on this home.
Original Mortgage
$130,000
Interest Rate
5.95%
Mortgage Type
Purchase Money Mortgage
Create a Home Valuation Report for This Property
The Home Valuation Report is an in-depth analysis detailing your home's value as well as a comparison with similar homes in the area
Home Values in the Area
Average Home Value in this Area
Purchase History
| Date | Buyer | Sale Price | Title Company |
|---|---|---|---|
| Power Robert J | $165,000 | Commerce Title Company | |
| U S Bank Na | $170,000 | None Available | |
| Cozzo Jeff Todd | $249,500 | Fidelity Natl Title Co Of Ca | |
| Guterding Jay Ernest | -- | -- |
Source: Public Records
Mortgage History
| Date | Status | Borrower | Loan Amount |
|---|---|---|---|
| Previous Owner | Cozzo Jeff Todd | $220,250 | |
| Previous Owner | Guterding Jay Ernest | $130,000 |
Source: Public Records
Tax History
| Year | Tax Paid | Tax Assessment Tax Assessment Total Assessment is a certain percentage of the fair market value that is determined by local assessors to be the total taxable value of land and additions on the property. | Land | Improvement |
|---|---|---|---|---|
| 2025 | $2,583 | $212,966 | $70,986 | $141,980 |
| 2024 | $2,545 | $208,792 | $69,595 | $139,197 |
| 2023 | $2,545 | $204,699 | $68,231 | $136,468 |
| 2022 | $2,461 | $200,687 | $66,894 | $133,793 |
| 2021 | $2,393 | $196,753 | $65,583 | $131,170 |
| 2020 | $2,383 | $194,737 | $64,911 | $129,826 |
| 2019 | $2,361 | $190,920 | $63,639 | $127,281 |
| 2018 | $2,330 | $187,178 | $62,392 | $124,786 |
| 2017 | $2,365 | $183,509 | $61,169 | $122,340 |
| 2016 | $2,222 | $179,912 | $59,970 | $119,942 |
| 2015 | $2,203 | $177,211 | $59,070 | $118,141 |
| 2014 | $1,943 | $160,000 | $35,000 | $125,000 |
Source: Public Records
Map
Nearby Homes
- 1088 Burton Dr
- 771 Flower Ash Ln
- 825 Mission Sierra Ct
- 1285 Lancers Ln
- 856 Mission de Oro Dr
- 1110 Grouse Dr
- 667 Reddington Dr
- 651 Mission de Oro Dr
- 531 Fair Hill Dr
- 1026 Palisades Ave
- 592 Mill Valley Pkwy
- 790 Volcano View Trail
- 720 Stonebriar Trail
- 775 Stonebriar Trail
- 724 Oakhurst Trail
- 953 Oakmont Dr
- 707 Alamine Dr
- 1991 Tiburon Dr
- 1750 Hawthorne Ct
- 639 Alamine Dr
- 878 Springer Dr Unit ONE
- 878 Springer Dr
- 890 Springer Dr
- 872 Springer Dr
- 910 Springer Dr
- 868 Springer Dr
- 879 Springer Dr
- 887 Springer Dr
- 920 Springer Dr
- 875 Springer Dr
- 862 Springer Dr
- 869 Springer Dr Unit 1
- 869 Springer Dr
- 930 Springer Dr
- 865 Springer Dr
- 878 Grouse Dr
- 872 Grouse Dr
- 858 Springer Dr
- 866 Grouse Dr
- 940 Springer Dr
Your Personal Tour Guide
Ask me questions while you tour the home.