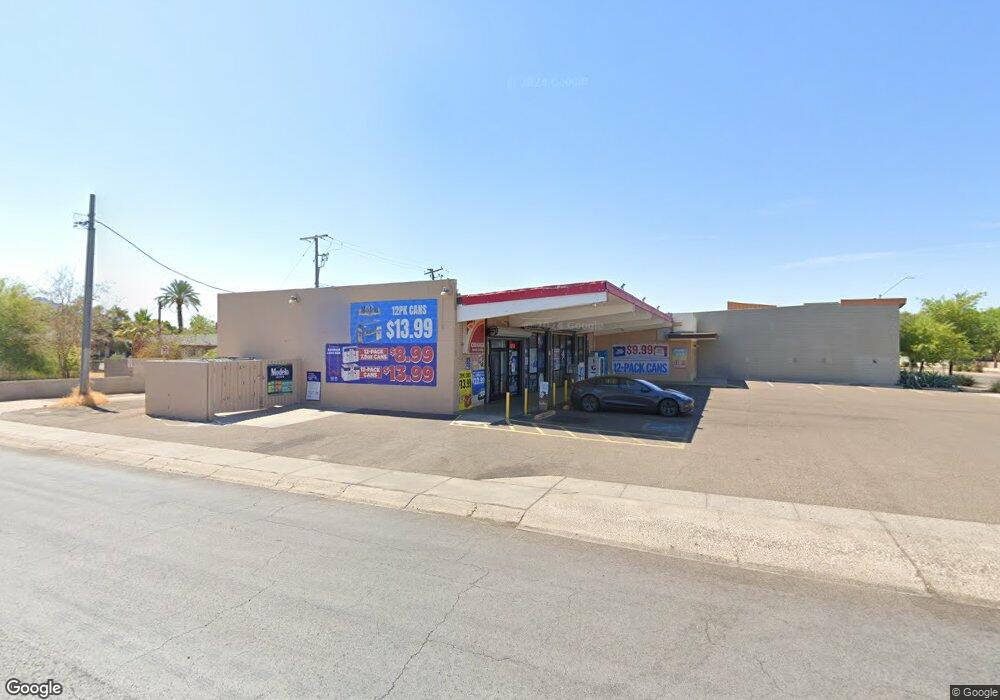
8843 N Central Ave Phoenix, AZ 85020
North Central Neighborhood
--
Bed
--
Bath
3,874
Sq Ft
6,273
Sq Ft Lot
About This Home
This home is located at 8843 N Central Ave, Phoenix, AZ 85020. 8843 N Central Ave is a home located in Maricopa County with nearby schools including Desert View Elementary School, Royal Palm Middle School, and Sunnyslope High School.
Ownership History
Date
Name
Owned For
Owner Type
Purchase Details
Closed on
Apr 27, 2018
Sold by
Iceland Corp
Bought by
Jainson Llc
Home Financials for this Owner
Home Financials are based on the most recent Mortgage that was taken out on this home.
Original Mortgage
$352,000
Outstanding Balance
$303,363
Interest Rate
4.44%
Mortgage Type
Commercial
Purchase Details
Closed on
Apr 25, 2018
Sold by
Jain Mili and Jain Nitin
Bought by
Jain Nitin
Home Financials for this Owner
Home Financials are based on the most recent Mortgage that was taken out on this home.
Original Mortgage
$352,000
Outstanding Balance
$303,363
Interest Rate
4.44%
Mortgage Type
Commercial
Purchase Details
Closed on
Aug 22, 2006
Sold by
Menashi Edward
Bought by
Iceland Corp
Purchase Details
Closed on
Oct 14, 2004
Sold by
Menashi Edward
Bought by
Menashi Edward
Purchase Details
Closed on
Jul 11, 2000
Sold by
Truong Rick and Truong Minh
Bought by
Menashi Edward
Purchase Details
Closed on
Oct 27, 1999
Sold by
Sierra Fox Llc
Bought by
Truong Rick and Truong Minh
Create a Home Valuation Report for This Property
The Home Valuation Report is an in-depth analysis detailing your home's value as well as a comparison with similar homes in the area
Home Values in the Area
Average Home Value in this Area
Purchase History
| Date | Buyer | Sale Price | Title Company |
|---|---|---|---|
| Jainson Llc | $440,000 | First American Title Insuran | |
| Jain Nitin | -- | First American Title Insuran | |
| Jain Dinesh | -- | First American Title Insuran | |
| Iceland Corp | -- | Tsa Title Agency | |
| Menashi Edward | -- | -- | |
| Menashi Edward | $360,000 | Fidelity National Title | |
| Truong Rick | $215,000 | Security Title Agency |
Source: Public Records
Mortgage History
| Date | Status | Borrower | Loan Amount |
|---|---|---|---|
| Open | Jainson Llc | $352,000 |
Source: Public Records
Tax History Compared to Growth
Tax History
| Year | Tax Paid | Tax Assessment Tax Assessment Total Assessment is a certain percentage of the fair market value that is determined by local assessors to be the total taxable value of land and additions on the property. | Land | Improvement |
|---|---|---|---|---|
| 2025 | $4,250 | $33,441 | -- | -- |
| 2024 | $4,267 | $32,843 | -- | -- |
| 2023 | $4,267 | $42,245 | $11,237 | $31,008 |
| 2022 | $4,249 | $38,361 | $9,818 | $28,543 |
| 2021 | $4,427 | $38,628 | $10,098 | $28,530 |
| 2020 | $4,316 | $38,664 | $10,494 | $28,170 |
| 2019 | $4,237 | $34,614 | $7,434 | $27,180 |
| 2018 | $4,126 | $32,760 | $6,858 | $25,902 |
| 2017 | $4,105 | $32,184 | $6,588 | $25,596 |
| 2016 | $4,031 | $29,394 | $6,246 | $23,148 |
| 2015 | $3,836 | $24,772 | $5,402 | $19,370 |
Source: Public Records
Map
Nearby Homes
- 214 E Ruth Ave Unit 312
- 8910 N 3rd St
- 8540 N Central Ave Unit 5
- 31 W Sunnyslope Ln
- 9011 N 3rd Dr
- 203 W Mission Ln
- 9042 N 3rd Ave
- 8510 N Central Ave Unit 16
- 9325 N Central Ave
- 225 W Orchid Ln
- 16 E Hatcher Rd
- 9520 N Central Ave
- 7 E Laurie Ln
- 226 E Carol Ave
- 8821 N 7th St Unit 200
- 8821 N 7th St Unit 100
- 9001 N 7th Ave
- 334 E Hatcher Rd
- 321 E Carol Ave
- 110 W Las Palmaritas Dr
- 17 E Townley Ave
- 8844 N 1st St
- 8836 N 1st St
- 8834 N 1st St
- 8830 N 1st St
- 8820 N 1st St
- 101 E Townley Ave
- 8841 N 1st St Unit A
- 8841 N 1st St Unit B
- 8841 N 1st St
- 8837 N 1st St
- 8835 N 1st St
- 8829 N 1st St
- 8828 N Central Ave
- 8910 N Central Ave
- 8831 N 1st St
- 8816 N 1st St
- 8844 N 2nd St
- 8844 N 2nd St Unit B
- 8844 N 2nd St Unit C