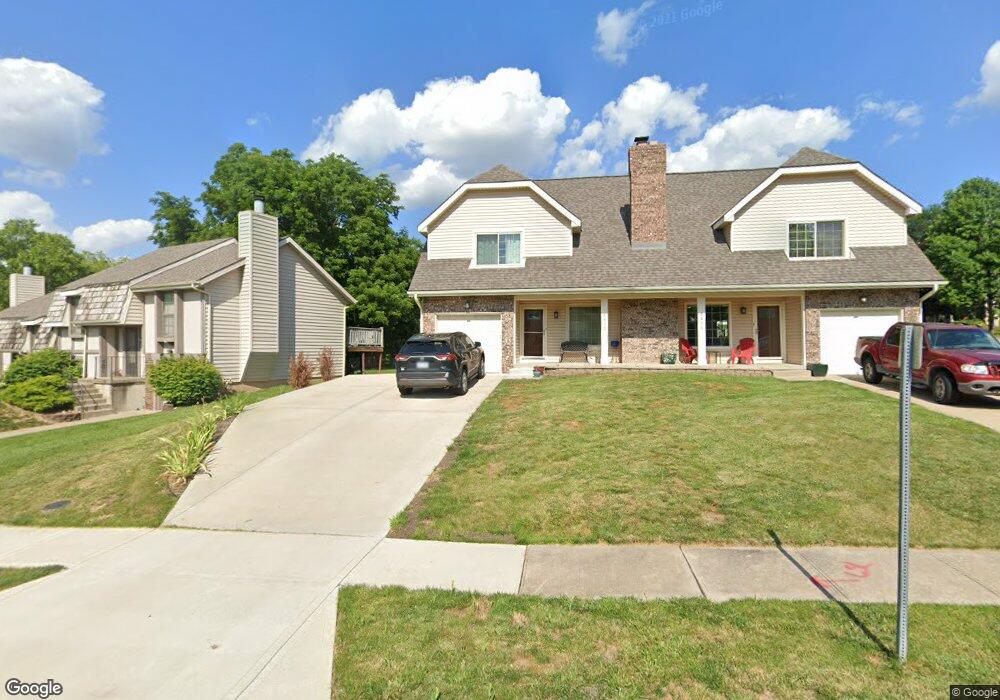
8853 Gallery St Lenexa, KS 66215
Estimated Value: $249,000 - $306,000
3
Beds
3
Baths
1,330
Sq Ft
$207/Sq Ft
Est. Value
About This Home
This home is located at 8853 Gallery St, Lenexa, KS 66215 and is currently estimated at $274,946, approximately $206 per square foot. 8853 Gallery St is a home located in Johnson County with nearby schools including Rising Star Elementary School, Westridge Middle School, and Shawnee Mission West High School.
Ownership History
Date
Name
Owned For
Owner Type
Purchase Details
Closed on
Jan 30, 2006
Sold by
Hursey Sherrie S
Bought by
Hawk Virginia E
Current Estimated Value
Home Financials for this Owner
Home Financials are based on the most recent Mortgage that was taken out on this home.
Original Mortgage
$10,000
Interest Rate
6.24%
Mortgage Type
New Conventional
Create a Home Valuation Report for This Property
The Home Valuation Report is an in-depth analysis detailing your home's value as well as a comparison with similar homes in the area
Home Values in the Area
Average Home Value in this Area
Purchase History
| Date | Buyer | Sale Price | Title Company |
|---|---|---|---|
| Hawk Virginia E | -- | Old Republic Title Co |
Source: Public Records
Mortgage History
| Date | Status | Borrower | Loan Amount |
|---|---|---|---|
| Previous Owner | Hawk Virginia E | $10,000 |
Source: Public Records
Tax History
| Year | Tax Paid | Tax Assessment Tax Assessment Total Assessment is a certain percentage of the fair market value that is determined by local assessors to be the total taxable value of land and additions on the property. | Land | Improvement |
|---|---|---|---|---|
| 2025 | $2,471 | $24,358 | $4,359 | $19,999 |
| 2024 | $2,471 | $22,620 | $2,801 | $19,819 |
| 2023 | $2,431 | $21,540 | $2,544 | $18,996 |
| 2022 | $2,207 | $19,516 | $2,312 | $17,204 |
| 2021 | $2,361 | $19,654 | $2,199 | $17,455 |
| 2020 | $2,252 | $18,538 | $1,998 | $16,540 |
| 2019 | $2,228 | $18,331 | $1,666 | $16,665 |
| 2018 | $2,265 | $17,146 | $1,666 | $15,480 |
| 2017 | $1,962 | $15,456 | $1,533 | $13,923 |
| 2016 | $1,865 | $14,490 | $1,533 | $12,957 |
| 2015 | $1,749 | $13,662 | $1,533 | $12,129 |
| 2013 | -- | $12,535 | $1,533 | $11,002 |
Source: Public Records
Map
Nearby Homes
- 14112 W 87th Terrace
- 14621 W 89th St
- 14640 W 90th St
- 14720 W 90th St
- 14718 W 91st Terrace
- 8914 Country Hill Ct
- 8362 Oakview Cir
- 14523 Brentwood Dr
- 8352 Oakview Cir
- 9212 Constance St
- 15113 W 91st Place
- 9412 Mullen Rd
- 9401 Cottonwood St
- 13204 W 85th Ct
- 8403 Swarner Dr
- 15514 W 89th St
- 13212 W 84th St
- 8221 Park St
- 14925 W 82nd Terrace
- 14808 W 94th Terrace
- 8855 Gallery St
- 8841 Gallery St
- 14134 W 88th Place
- 14132 W 88th Place
- 8829 Gallery St
- 8856 Gallery St
- 14128 W 88th Place
- 8854 Gallery St
- 14139 W 88th Place
- 14141 W 88th Place
- 8848 Gallery St
- 8860 Gallery St
- 14133 W 88th Place
- 14126 W 88th Place
- 8823 Gallery St
- 8842 Gallery St
- 8866 Gallery St
- 14122 W 88th Place
- 14127 W 88th Place
- 8836 Gallery St
Your Personal Tour Guide
Ask me questions while you tour the home.