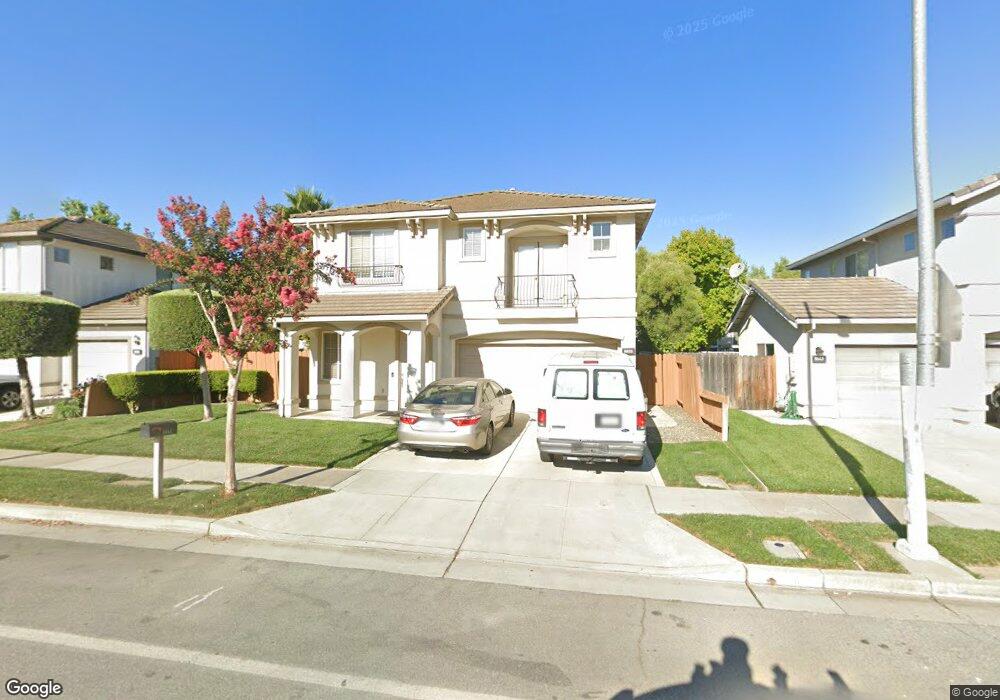
8855 Kern Ave Gilroy, CA 95020
Las Animas NeighborhoodEstimated Value: $883,000 - $930,042
4
Beds
3
Baths
1,838
Sq Ft
$492/Sq Ft
Est. Value
About This Home
This home is located at 8855 Kern Ave, Gilroy, CA 95020 and is currently estimated at $903,511, approximately $491 per square foot. 8855 Kern Ave is a home located in Santa Clara County with nearby schools including Rod Kelley Elementary School, South Valley Middle School, and Solorsano Middle School.
Ownership History
Date
Name
Owned For
Owner Type
Purchase Details
Closed on
Mar 18, 2009
Sold by
The Bank Of New York
Bought by
Villafuerte Martha and Lopez Juan
Current Estimated Value
Home Financials for this Owner
Home Financials are based on the most recent Mortgage that was taken out on this home.
Original Mortgage
$289,600
Outstanding Balance
$181,961
Interest Rate
5.15%
Mortgage Type
Purchase Money Mortgage
Estimated Equity
$721,550
Purchase Details
Closed on
Aug 21, 2008
Sold by
Truong Lily
Bought by
The Bank Of New York
Purchase Details
Closed on
Feb 14, 2006
Sold by
Gmd Development Inc
Bought by
Truong Lily
Home Financials for this Owner
Home Financials are based on the most recent Mortgage that was taken out on this home.
Original Mortgage
$73,900
Interest Rate
6.2%
Mortgage Type
Credit Line Revolving
Create a Home Valuation Report for This Property
The Home Valuation Report is an in-depth analysis detailing your home's value as well as a comparison with similar homes in the area
Home Values in the Area
Average Home Value in this Area
Purchase History
| Date | Buyer | Sale Price | Title Company |
|---|---|---|---|
| Villafuerte Martha | $362,000 | First American Title Company | |
| The Bank Of New York | $560,000 | Chicago Title Insurance Co | |
| Truong Lily | $740,000 | Old Republic Title Company |
Source: Public Records
Mortgage History
| Date | Status | Borrower | Loan Amount |
|---|---|---|---|
| Open | Villafuerte Martha | $289,600 | |
| Previous Owner | Truong Lily | $73,900 | |
| Previous Owner | Truong Lily | $591,960 |
Source: Public Records
Tax History
| Year | Tax Paid | Tax Assessment Tax Assessment Total Assessment is a certain percentage of the fair market value that is determined by local assessors to be the total taxable value of land and additions on the property. | Land | Improvement |
|---|---|---|---|---|
| 2025 | $5,645 | $466,154 | $193,156 | $272,998 |
| 2024 | $5,645 | $457,015 | $189,369 | $267,646 |
| 2023 | $5,610 | $448,055 | $185,656 | $262,399 |
| 2022 | $5,516 | $439,270 | $182,016 | $257,254 |
| 2021 | $5,489 | $430,658 | $178,448 | $252,210 |
| 2020 | $5,428 | $426,243 | $176,619 | $249,624 |
| 2019 | $5,376 | $417,886 | $173,156 | $244,730 |
| 2018 | $5,020 | $409,693 | $169,761 | $239,932 |
| 2017 | $5,123 | $401,661 | $166,433 | $235,228 |
| 2016 | $5,015 | $393,786 | $163,170 | $230,616 |
| 2015 | $4,732 | $387,872 | $160,720 | $227,152 |
| 2014 | $4,701 | $380,275 | $157,572 | $222,703 |
Source: Public Records
Map
Nearby Homes
- 735 Painter Ct
- 1206 Sycamore Ct
- 1008 Primrose Ln
- 946 Martiri Ct
- 1320 Heritage Way
- 8170 Westwood Dr Unit 22
- 1165 Lerma Ln
- 760 Welburn Ave
- 1404 Casablanca Cir
- 9400 Benbow Dr
- 1501 Welburn Ave
- 401 Arnold Dr
- 8120 Catalina Ct
- 119 Farrell Ave
- 103 Farrell Ave
- 111 Farrell Ave
- 1231 Juniper Dr Unit H
- 1610 Calabrese Way
- 7942 English Oak Cir
- 7902 English Oak Cir
Your Personal Tour Guide
Ask me questions while you tour the home.