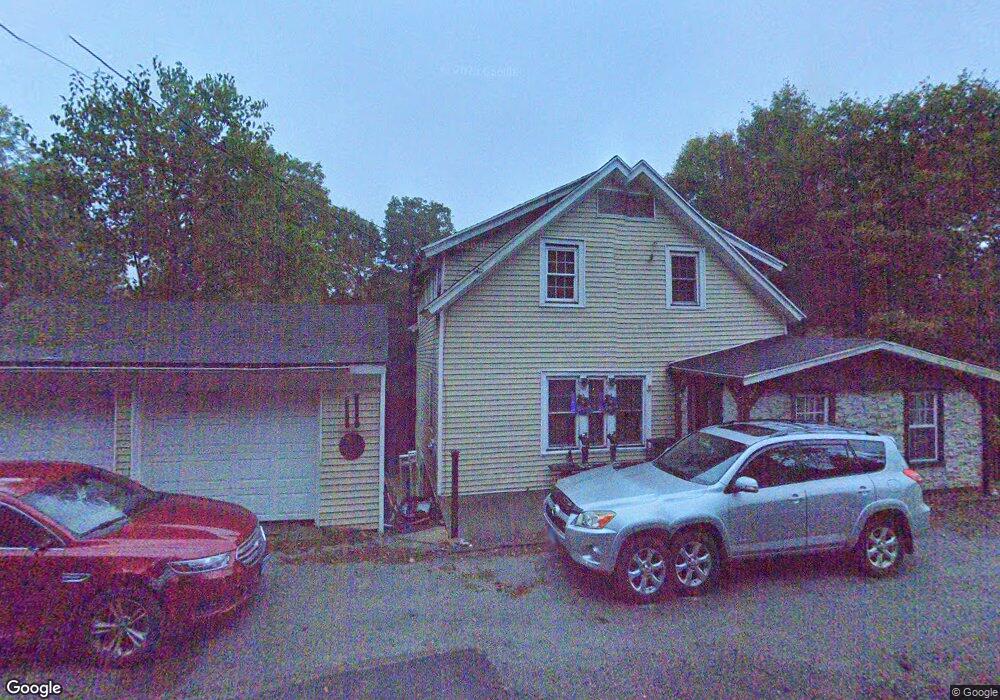
886 Main St Somers, CT 06071
Estimated Value: $323,000 - $336,000
4
Beds
2
Baths
1,583
Sq Ft
$209/Sq Ft
Est. Value
About This Home
This home is located at 886 Main St, Somers, CT 06071 and is currently estimated at $330,526, approximately $208 per square foot. 886 Main St is a home located in Tolland County with nearby schools including Somers Elementary School, Mabelle B. Avery Middle School, and Somers High School.
Ownership History
Date
Name
Owned For
Owner Type
Purchase Details
Closed on
Sep 9, 2021
Sold by
Parrow Donna R
Bought by
Sanborn Carly
Current Estimated Value
Purchase Details
Closed on
Jan 3, 2011
Sold by
Li Xi
Bought by
Parrow Paul M and Parrow Donna R
Purchase Details
Closed on
Oct 12, 2007
Sold by
Wmc Mortgage Corp
Bought by
Li Xi
Home Financials for this Owner
Home Financials are based on the most recent Mortgage that was taken out on this home.
Original Mortgage
$72,800
Interest Rate
6.49%
Purchase Details
Closed on
Nov 13, 2006
Sold by
Rosemond Solomon
Bought by
Mccauley Jeffrey
Purchase Details
Closed on
Sep 19, 2003
Sold by
Allard Eugene
Bought by
Solomon Rosemond
Create a Home Valuation Report for This Property
The Home Valuation Report is an in-depth analysis detailing your home's value as well as a comparison with similar homes in the area
Home Values in the Area
Average Home Value in this Area
Purchase History
| Date | Buyer | Sale Price | Title Company |
|---|---|---|---|
| Sanborn Carly | -- | None Available | |
| Sanborn Carly | -- | None Available | |
| Parrow Paul M | $86,000 | -- | |
| Parrow Paul M | $86,000 | -- | |
| Li Xi | $85,000 | -- | |
| Li Xi | $85,000 | -- | |
| Mccauley Jeffrey | $259,900 | -- | |
| Mccauley Jeffrey | $259,900 | -- | |
| Solomon Rosemond | $82,500 | -- | |
| Solomon Rosemond | $82,500 | -- |
Source: Public Records
Mortgage History
| Date | Status | Borrower | Loan Amount |
|---|---|---|---|
| Previous Owner | Solomon Rosemond | $130,000 | |
| Previous Owner | Solomon Rosemond | $72,800 |
Source: Public Records
Tax History Compared to Growth
Tax History
| Year | Tax Paid | Tax Assessment Tax Assessment Total Assessment is a certain percentage of the fair market value that is determined by local assessors to be the total taxable value of land and additions on the property. | Land | Improvement |
|---|---|---|---|---|
| 2025 | $3,106 | $102,800 | $35,100 | $67,700 |
| 2024 | $2,977 | $102,800 | $35,100 | $67,700 |
| 2023 | $2,910 | $102,800 | $35,100 | $67,700 |
| 2022 | $2,833 | $102,800 | $35,100 | $67,700 |
| 2021 | $2,741 | $102,800 | $35,100 | $67,700 |
| 2020 | $2,586 | $94,500 | $35,100 | $59,400 |
| 2019 | $2,540 | $92,800 | $38,200 | $54,600 |
| 2018 | $2,540 | $92,800 | $38,200 | $54,600 |
| 2017 | $2,364 | $92,800 | $38,200 | $54,600 |
| 2016 | $2,248 | $92,800 | $38,200 | $54,600 |
| 2015 | $2,900 | $124,100 | $47,600 | $76,500 |
| 2014 | $2,900 | $124,100 | $47,600 | $76,500 |
Source: Public Records
Map
Nearby Homes