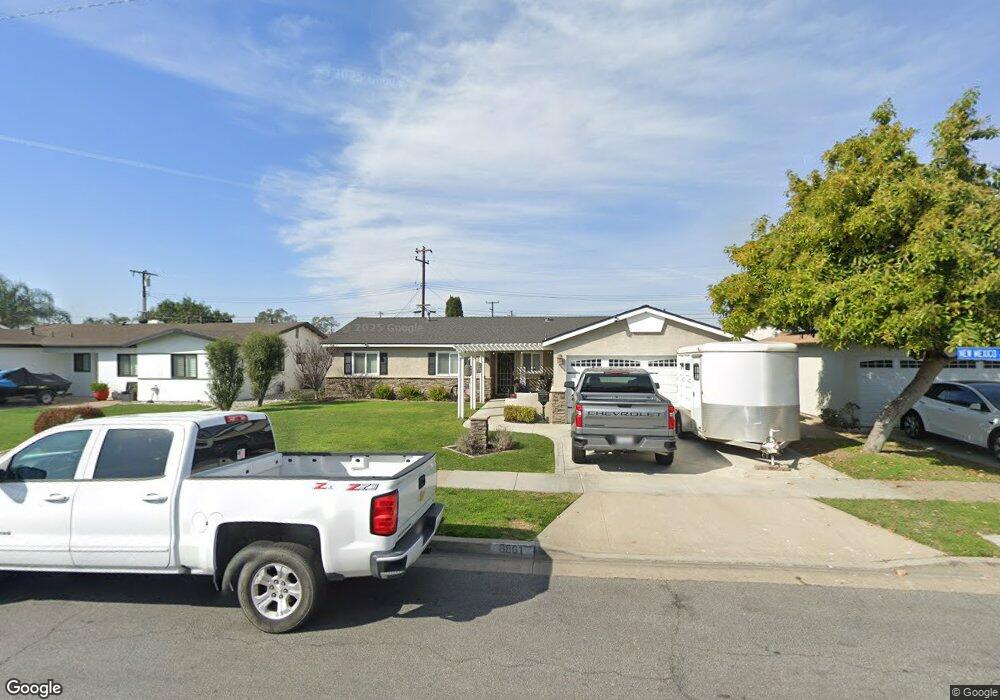
8861 Lanett St Cypress, CA 90630
Estimated Value: $971,000 - $1,063,000
3
Beds
2
Baths
1,453
Sq Ft
$703/Sq Ft
Est. Value
About This Home
This home is located at 8861 Lanett St, Cypress, CA 90630 and is currently estimated at $1,021,000, approximately $702 per square foot. 8861 Lanett St is a home located in Orange County with nearby schools including Clara J. King Elementary School, Walker Junior High School, and John F. Kennedy High School.
Ownership History
Date
Name
Owned For
Owner Type
Purchase Details
Closed on
Jan 8, 2016
Sold by
Harris Nicholas
Bought by
Harris Nicholas and Nicholas Harris 2016 Trust
Current Estimated Value
Purchase Details
Closed on
Jul 24, 2015
Sold by
Harris Nicholas C
Bought by
Harris Nicholas and Harris Kimberly
Purchase Details
Closed on
Aug 4, 2011
Sold by
Harris Nicholas C
Bought by
Harris Nicholas C and Nicholas C Harris 2011 Trust
Purchase Details
Closed on
Dec 23, 2008
Sold by
Hendrick Nora
Bought by
Harris Nicholas C
Home Financials for this Owner
Home Financials are based on the most recent Mortgage that was taken out on this home.
Original Mortgage
$248,000
Outstanding Balance
$155,739
Interest Rate
5.14%
Mortgage Type
Purchase Money Mortgage
Estimated Equity
$865,261
Purchase Details
Closed on
Nov 15, 1995
Sold by
Harris Beatrice
Bought by
Harris Beatrice
Create a Home Valuation Report for This Property
The Home Valuation Report is an in-depth analysis detailing your home's value as well as a comparison with similar homes in the area
Home Values in the Area
Average Home Value in this Area
Purchase History
| Date | Buyer | Sale Price | Title Company |
|---|---|---|---|
| Harris Nicholas | -- | None Available | |
| Harris Nicholas | -- | None Available | |
| Harris Nicholas | -- | None Available | |
| Harris Nicholas C | -- | None Available | |
| Harris Nicholas C | $310,000 | Commonwealth Title | |
| Harris Beatrice | -- | -- |
Source: Public Records
Mortgage History
| Date | Status | Borrower | Loan Amount |
|---|---|---|---|
| Open | Harris Nicholas C | $248,000 |
Source: Public Records
Tax History
| Year | Tax Paid | Tax Assessment Tax Assessment Total Assessment is a certain percentage of the fair market value that is determined by local assessors to be the total taxable value of land and additions on the property. | Land | Improvement |
|---|---|---|---|---|
| 2025 | $4,412 | $384,750 | $250,268 | $134,482 |
| 2024 | $4,412 | $377,206 | $245,360 | $131,846 |
| 2023 | $3,804 | $323,290 | $240,549 | $82,741 |
| 2022 | $3,756 | $316,951 | $235,832 | $81,119 |
| 2021 | $3,706 | $310,737 | $231,208 | $79,529 |
| 2020 | $3,690 | $307,551 | $228,837 | $78,714 |
| 2019 | $3,589 | $301,521 | $224,350 | $77,171 |
| 2018 | $3,540 | $295,609 | $219,951 | $75,658 |
| 2017 | $3,420 | $289,813 | $215,638 | $74,175 |
| 2016 | $3,390 | $284,131 | $211,410 | $72,721 |
| 2015 | $3,165 | $261,981 | $208,234 | $53,747 |
| 2014 | $3,001 | $256,850 | $204,155 | $52,695 |
Source: Public Records
Map
Nearby Homes
- 8762 La Salle St
- 8689 Moody St
- 8792 Grindlay St
- 4891 Grace Ave
- 8521 Via Tina
- 9066 Candlestick Ln Unit 5
- 5342 Bishop St
- 8622 Watson St
- 5447 Twin Lakes Dr
- 5475 Twin Lakes Dr
- 4811 Newman Ave
- 5572 Saint Ann Ave
- 9220 Whitney Way
- 5000 Clementine Ln
- 6007 Clementine Ln Unit 21
- 9001 Cerise Ln Unit 109
- 9001 Cerise Ln Unit 113
- 9011 Cerise Ln Unit 129
- 5201 Del Serra Cir
- 8342 Fontainbleau Way
- 8851 Lanett St
- 8871 Lanett St
- 8862 Belday St
- 8841 Lanett St
- 8881 Lanett St
- 8852 Belday St
- 8872 Belday St
- 5092 New Mexico Ln
- 8842 Belday St
- 8882 Belday St
- 5081 New Mexico Ln
- 5091 New Mexico Ln
- 8821 Lanett St
- 8822 Belday St
- 5102 New Mexico Ln
- 5091 Alaska Ave
- 5101 New Mexico Ln
- 5092 Lolina Ln
- 8811 Lanett St
- 8812 Belday St
Your Personal Tour Guide
Ask me questions while you tour the home.