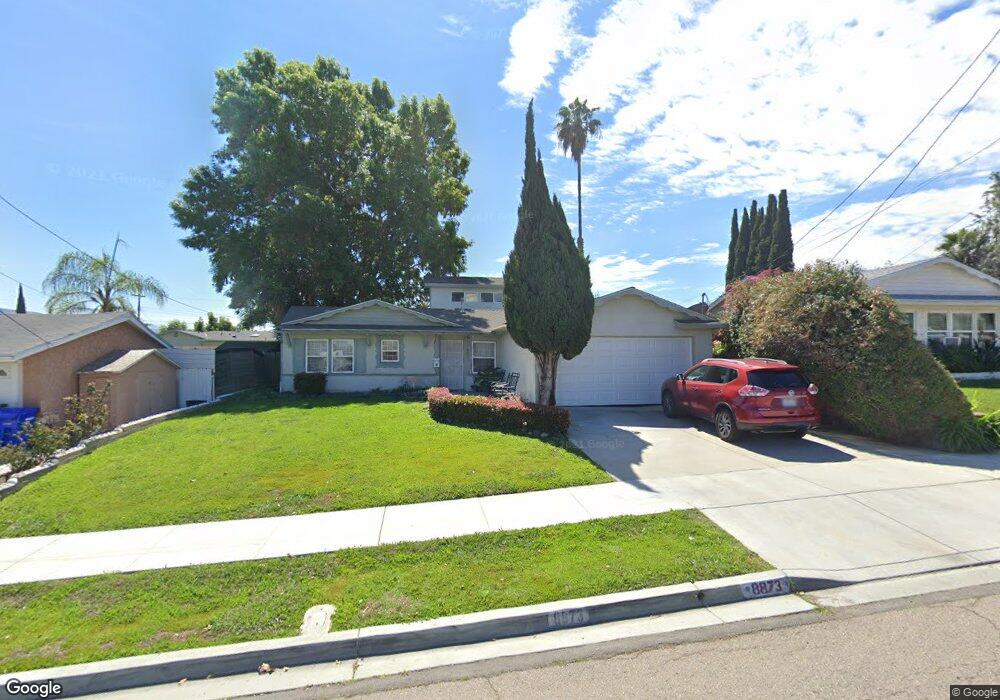
8873 Lance Ave Spring Valley, CA 91977
Estimated Value: $716,425 - $788,000
4
Beds
3
Baths
1,538
Sq Ft
$483/Sq Ft
Est. Value
About This Home
This home is located at 8873 Lance Ave, Spring Valley, CA 91977 and is currently estimated at $742,606, approximately $482 per square foot. 8873 Lance Ave is a home located in San Diego County with nearby schools including Rancho Elementary School, Science, Technology, Engineering, Arts, And Math Academy, and Mount Miguel High School.
Ownership History
Date
Name
Owned For
Owner Type
Purchase Details
Closed on
May 16, 2005
Sold by
Napoli Marsha Ann
Bought by
Napoli Marsha Ann
Current Estimated Value
Home Financials for this Owner
Home Financials are based on the most recent Mortgage that was taken out on this home.
Original Mortgage
$132,000
Interest Rate
5.87%
Mortgage Type
New Conventional
Purchase Details
Closed on
May 12, 2005
Sold by
Napoli Marsha Ann
Bought by
Napoli Marsha Ann
Home Financials for this Owner
Home Financials are based on the most recent Mortgage that was taken out on this home.
Original Mortgage
$132,000
Interest Rate
5.87%
Mortgage Type
New Conventional
Purchase Details
Closed on
Sep 17, 1998
Sold by
Napoli Marsha A
Bought by
Napoli Marsha Ann
Create a Home Valuation Report for This Property
The Home Valuation Report is an in-depth analysis detailing your home's value as well as a comparison with similar homes in the area
Home Values in the Area
Average Home Value in this Area
Purchase History
| Date | Buyer | Sale Price | Title Company |
|---|---|---|---|
| Napoli Marsha Ann | -- | -- | |
| Napoli Marsha Ann | -- | First American Title | |
| Napoli Marsha Ann | -- | -- |
Source: Public Records
Mortgage History
| Date | Status | Borrower | Loan Amount |
|---|---|---|---|
| Closed | Napoli Marsha Ann | $132,000 |
Source: Public Records
Tax History
| Year | Tax Paid | Tax Assessment Tax Assessment Total Assessment is a certain percentage of the fair market value that is determined by local assessors to be the total taxable value of land and additions on the property. | Land | Improvement |
|---|---|---|---|---|
| 2025 | $2,182 | $142,244 | $19,141 | $123,103 |
| 2024 | $2,182 | $139,456 | $18,766 | $120,690 |
| 2023 | $2,098 | $136,723 | $18,399 | $118,324 |
| 2022 | $2,050 | $134,043 | $18,039 | $116,004 |
| 2021 | $2,035 | $131,416 | $17,686 | $113,730 |
| 2020 | $1,942 | $130,069 | $17,505 | $112,564 |
| 2019 | $1,911 | $127,519 | $17,162 | $110,357 |
| 2018 | $1,833 | $125,020 | $16,826 | $108,194 |
| 2017 | $830 | $122,570 | $16,497 | $106,073 |
| 2016 | $1,690 | $120,168 | $16,174 | $103,994 |
| 2015 | $1,673 | $118,364 | $15,932 | $102,432 |
| 2014 | $1,650 | $116,046 | $15,620 | $100,426 |
Source: Public Records
Map
Nearby Homes
- 557 Parkbrook St
- 753 Elkelton Blvd
- 524 Parkbrook St
- 738 Carlsbad St
- 8739 Saint George St
- 310 Worthington St
- 9011 Joan St
- 1040 Gillespie Dr
- 9017 Orville St
- 8432 Parkbrook St
- 383 Vecino Ct
- 8364 Cacus St
- 8402 Lockland Ct
- 8840 Leigh Ave Unit 12
- 517 Sears Ave
- 1145 Helix St Unit 13
- 1145 Helix St Unit 1
- 9125 Akard St
- 8773 Leigh Ave
- 166 Lakeview Ave
- 8867 Lance Ave
- 8879 Lance Ave
- 8870 Milburn Ave
- 8876 Milburn Ave
- 8864 Milburn Ave
- 8885 Lance Ave
- 8861 Lance Ave
- 8874 Lance Ave
- 8882 Milburn Ave
- 8858 Milburn Ave
- 8868 Lance Ave
- 8880 Lance Ave
- 8891 Lance Ave
- 8855 Lance Ave
- 8862 Lance Ave
- 8886 Lance Ave
- 8888 Milburn Ave
- 8852 Milburn Ave
- 8856 Lance Ave
- 8871 Kelburn Ave
Your Personal Tour Guide
Ask me questions while you tour the home.