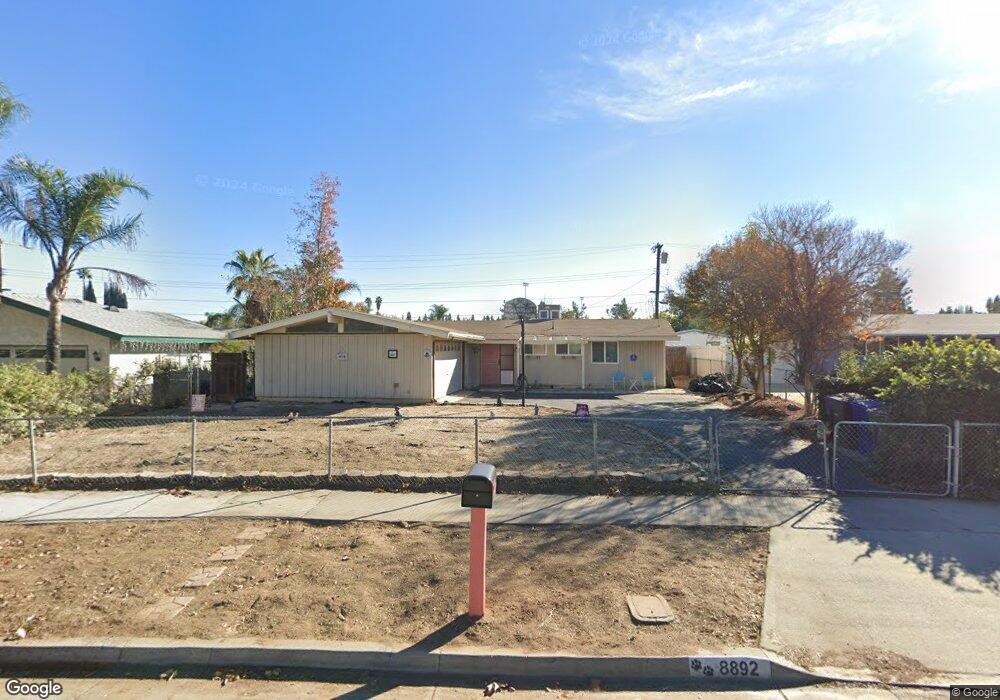
8892 Haskell St Riverside, CA 92503
Presidential Park NeighborhoodEstimated Value: $507,000 - $593,000
3
Beds
2
Baths
1,188
Sq Ft
$459/Sq Ft
Est. Value
About This Home
This home is located at 8892 Haskell St, Riverside, CA 92503 and is currently estimated at $545,052, approximately $458 per square foot. 8892 Haskell St is a home located in Riverside County with nearby schools including Hawthorne Elementary School, Chemawa Middle School, and Arlington High School.
Ownership History
Date
Name
Owned For
Owner Type
Purchase Details
Closed on
Oct 23, 2002
Sold by
Chudzicki Michael Edward and Chudzicki Donna Lynn
Bought by
Wesley Mitchell Sherry L
Current Estimated Value
Home Financials for this Owner
Home Financials are based on the most recent Mortgage that was taken out on this home.
Original Mortgage
$138,465
Interest Rate
7.25%
Mortgage Type
Purchase Money Mortgage
Purchase Details
Closed on
Jul 2, 2002
Sold by
Bullins Glenn
Bought by
Chudzicki Michael Edward and Chudzicki Donna Lynn
Purchase Details
Closed on
Apr 13, 1999
Sold by
Talamantez Gary M and Talamantez Josephine D
Bought by
Bullins Glenn
Home Financials for this Owner
Home Financials are based on the most recent Mortgage that was taken out on this home.
Original Mortgage
$93,839
Interest Rate
6.86%
Mortgage Type
VA
Purchase Details
Closed on
Dec 13, 1995
Sold by
Talamantez Maria T
Bought by
Talamantez Gary M
Create a Home Valuation Report for This Property
The Home Valuation Report is an in-depth analysis detailing your home's value as well as a comparison with similar homes in the area
Home Values in the Area
Average Home Value in this Area
Purchase History
| Date | Buyer | Sale Price | Title Company |
|---|---|---|---|
| Wesley Mitchell Sherry L | $163,000 | Commonwealth Land Title Co | |
| Chudzicki Michael Edward | $105,000 | Commonwealth Land Title Co | |
| Bullins Glenn | $92,000 | American Title Co | |
| Talamantez Gary M | -- | -- |
Source: Public Records
Mortgage History
| Date | Status | Borrower | Loan Amount |
|---|---|---|---|
| Previous Owner | Wesley Mitchell Sherry L | $138,465 | |
| Previous Owner | Bullins Glenn | $93,839 | |
| Closed | Wesley Mitchell Sherry L | $16,290 |
Source: Public Records
Tax History
| Year | Tax Paid | Tax Assessment Tax Assessment Total Assessment is a certain percentage of the fair market value that is determined by local assessors to be the total taxable value of land and additions on the property. | Land | Improvement |
|---|---|---|---|---|
| 2025 | $2,521 | $235,907 | $65,158 | $170,749 |
| 2023 | $2,521 | $226,748 | $62,629 | $164,119 |
| 2022 | $2,461 | $222,302 | $61,401 | $160,901 |
| 2021 | $2,437 | $217,945 | $60,198 | $157,747 |
| 2020 | $2,418 | $215,711 | $59,581 | $156,130 |
| 2019 | $2,372 | $211,482 | $58,413 | $153,069 |
| 2018 | $2,325 | $207,336 | $57,268 | $150,068 |
| 2017 | $2,283 | $203,272 | $56,146 | $147,126 |
| 2016 | $2,137 | $199,288 | $55,046 | $144,242 |
| 2015 | $2,106 | $196,296 | $54,220 | $142,076 |
| 2014 | $2,084 | $192,453 | $53,159 | $139,294 |
Source: Public Records
Map
Nearby Homes
- 8864 Haskell St
- 3048 Strassbourg Dr
- 3306 Brou Ln
- 0 Jackson St
- 3190 Madrone Ln
- 9179 Teralina Cir
- 9170 Teralina Cir
- 9175 Teralina Cir
- 9183 Teralina Cir
- 3192 Arvoredo Ln
- 8680 Indiana Ave
- 9187 Waverly Ln
- 9191 Waverly Ln
- 9195 Waverly Ln
- 9194 Connolly Ln
- 9198 Connolly Ln
- 9187 Connolly Ln
- 9186 Connolly Ln
- 9190 Connolly Ln
- 9195 Connolly Ln
- 8900 Haskell St
- 8884 Haskell St
- 8870 Haskell St
- 8904 Haskell St
- 8901 Haskell St
- 8835 Toronto Rd
- 8894 Marlene St
- 8908 Haskell St
- 8907 Haskell St
- 8845 Toronto Rd
- 8854 Haskell St
- 8882 Marlene St
- 8912 Haskell St
- 8919 Haskell St
- 8855 Haskell St
- 8855 Toronto Rd
- 8844 Haskell St
- 8883 Marlene St
- 3069 Irving St
- 8916 Haskell St
Your Personal Tour Guide
Ask me questions while you tour the home.