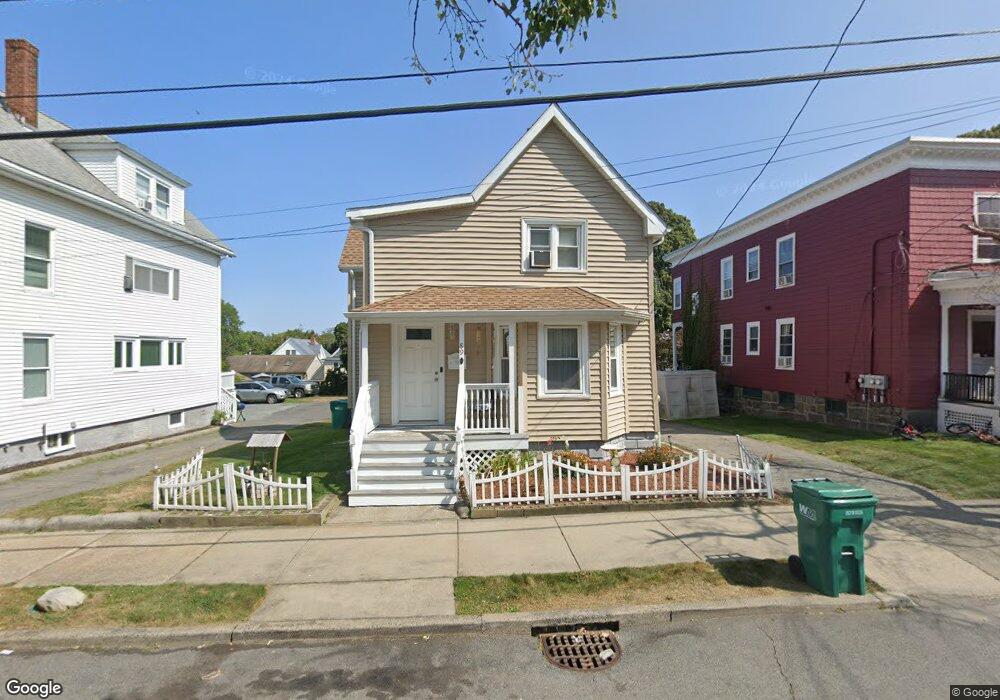
89 Ashland St Lynn, MA 01905
Lower Boston Street NeighborhoodEstimated Value: $482,000 - $566,000
3
Beds
1
Bath
1,150
Sq Ft
$447/Sq Ft
Est. Value
About This Home
This home is located at 89 Ashland St, Lynn, MA 01905 and is currently estimated at $513,642, approximately $446 per square foot. 89 Ashland St is a home located in Essex County with nearby schools including William R. Fallon School, Drewicz Elementary School, and Breed Middle School.
Ownership History
Date
Name
Owned For
Owner Type
Purchase Details
Closed on
Jul 1, 1999
Sold by
A James Lynch Inc
Bought by
Hight David and Hight Dorothy
Current Estimated Value
Purchase Details
Closed on
Dec 10, 1998
Sold by
Est Modugno Norma M and Mcdonough Lydia A
Bought by
A James Lynch Inc
Create a Home Valuation Report for This Property
The Home Valuation Report is an in-depth analysis detailing your home's value as well as a comparison with similar homes in the area
Home Values in the Area
Average Home Value in this Area
Purchase History
| Date | Buyer | Sale Price | Title Company |
|---|---|---|---|
| Hight David | $144,900 | -- | |
| Hight David | $144,900 | -- | |
| A James Lynch Inc | $72,500 | -- | |
| A James Lynch Inc | $72,500 | -- |
Source: Public Records
Mortgage History
| Date | Status | Borrower | Loan Amount |
|---|---|---|---|
| Open | A James Lynch Inc | $227,675 | |
| Closed | A James Lynch Inc | $225,928 |
Source: Public Records
Tax History
| Year | Tax Paid | Tax Assessment Tax Assessment Total Assessment is a certain percentage of the fair market value that is determined by local assessors to be the total taxable value of land and additions on the property. | Land | Improvement |
|---|---|---|---|---|
| 2025 | $5,251 | $506,900 | $207,000 | $299,900 |
| 2024 | $5,002 | $475,000 | $192,500 | $282,500 |
| 2023 | $5,120 | $459,200 | $212,900 | $246,300 |
| 2022 | $4,748 | $382,000 | $163,100 | $218,900 |
| 2021 | $4,490 | $344,600 | $140,900 | $203,700 |
| 2020 | $4,351 | $324,700 | $144,500 | $180,200 |
| 2019 | $4,266 | $298,300 | $129,100 | $169,200 |
| 2018 | $3,889 | $256,700 | $116,400 | $140,300 |
| 2017 | $3,708 | $237,700 | $101,900 | $135,800 |
| 2016 | $3,590 | $221,900 | $93,800 | $128,100 |
| 2015 | $3,482 | $207,900 | $96,500 | $111,400 |
Source: Public Records
Map
Nearby Homes
- 79 Laurel St
- 28 Wyman St
- 45 Cottage St Unit 3
- 73 Waterhill St
- 20 Murray St
- 16 River St Unit 6
- 21 Fenton Ave
- 10 River Street Place
- 50-50A Kirtland St
- 37 Sargents Ct
- 268 Walnut St
- 93 Robinson St
- 32 Birch Brook Landing Unit 25
- 32 Birch Brook Landing Unit 22
- 32 Birch Brook Rd Unit 13
- 32 Birch Brook Rd Unit 27
- 32 Birch Brook Rd Unit 26
- 32 Birch Brook Rd Unit 16
- 32 Birch Brook Rd Unit 1
- 32 Birch Brook Rd Unit 15
Your Personal Tour Guide
Ask me questions while you tour the home.