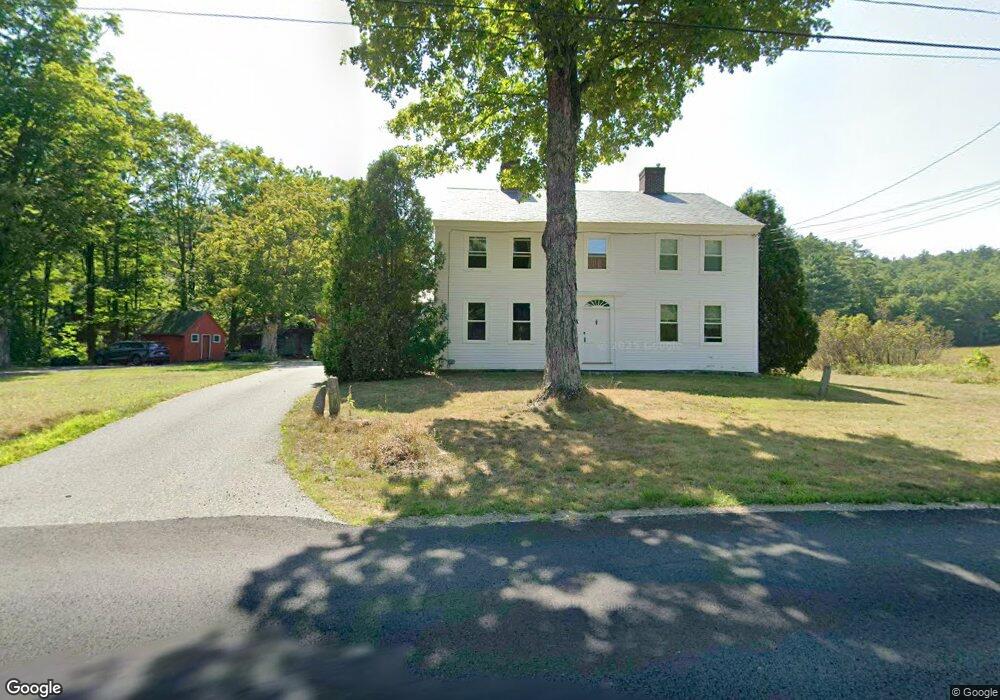
89 Elm St New Salem, MA 01355
New Salem NeighborhoodEstimated Value: $541,954 - $1,014,000
5
Beds
4
Baths
4,833
Sq Ft
$140/Sq Ft
Est. Value
About This Home
This home is located at 89 Elm St, New Salem, MA 01355 and is currently estimated at $676,489, approximately $139 per square foot. 89 Elm St is a home located in Franklin County with nearby schools including Swift River School and Ralph C Mahar Regional School.
Ownership History
Date
Name
Owned For
Owner Type
Purchase Details
Closed on
Sep 24, 2008
Sold by
Kraft Janet F
Bought by
Frost Adam H and Frost Andrea B
Current Estimated Value
Home Financials for this Owner
Home Financials are based on the most recent Mortgage that was taken out on this home.
Original Mortgage
$417,000
Outstanding Balance
$279,152
Interest Rate
6.57%
Mortgage Type
Purchase Money Mortgage
Estimated Equity
$397,337
Create a Home Valuation Report for This Property
The Home Valuation Report is an in-depth analysis detailing your home's value as well as a comparison with similar homes in the area
Home Values in the Area
Average Home Value in this Area
Purchase History
| Date | Buyer | Sale Price | Title Company |
|---|---|---|---|
| Frost Adam H | $550,000 | -- |
Source: Public Records
Mortgage History
| Date | Status | Borrower | Loan Amount |
|---|---|---|---|
| Open | Frost Adam H | $417,000 |
Source: Public Records
Tax History Compared to Growth
Tax History
| Year | Tax Paid | Tax Assessment Tax Assessment Total Assessment is a certain percentage of the fair market value that is determined by local assessors to be the total taxable value of land and additions on the property. | Land | Improvement |
|---|---|---|---|---|
| 2025 | $6,828 | $502,800 | $52,800 | $450,000 |
| 2024 | $6,668 | $464,000 | $52,800 | $411,200 |
| 2023 | $7,036 | $458,400 | $54,100 | $404,300 |
| 2022 | $7,759 | $410,100 | $54,100 | $356,000 |
| 2021 | $6,301 | $378,200 | $49,600 | $328,600 |
| 2020 | $6,378 | $378,200 | $49,600 | $328,600 |
| 2019 | $6,645 | $378,200 | $49,600 | $328,600 |
| 2018 | $6,632 | $365,800 | $48,100 | $317,700 |
| 2017 | $6,322 | $352,600 | $45,900 | $306,700 |
| 2016 | $6,075 | $352,600 | $45,900 | $306,700 |
Source: Public Records
Map
Nearby Homes