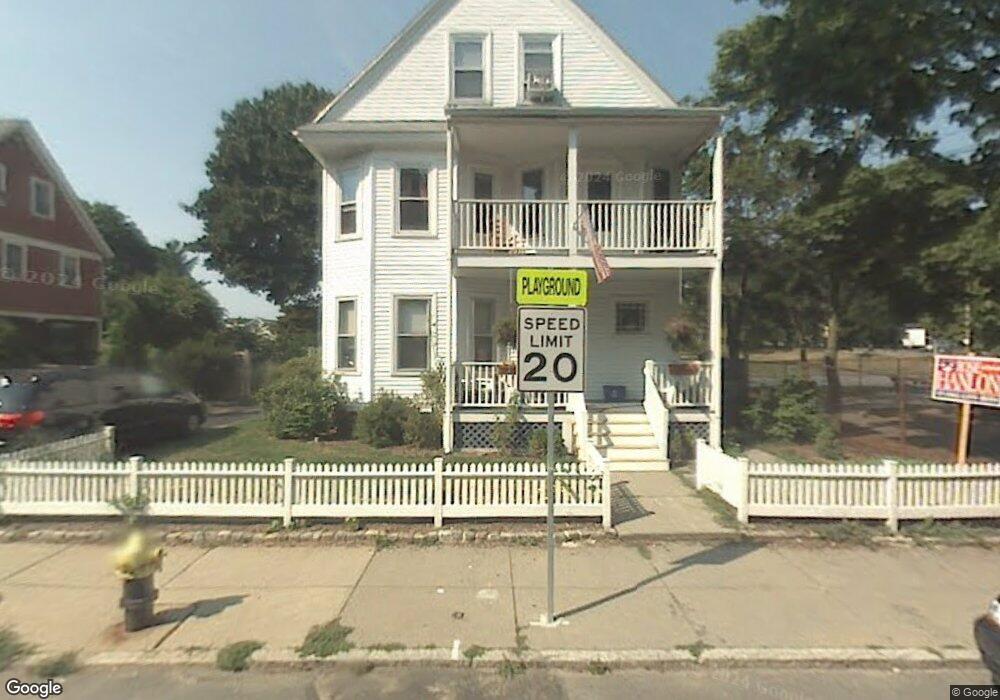
89 Hobart St Brighton, MA 02135
Brighton NeighborhoodEstimated Value: $1,255,000 - $1,349,000
6
Beds
3
Baths
2,928
Sq Ft
$447/Sq Ft
Est. Value
About This Home
This home is located at 89 Hobart St, Brighton, MA 02135 and is currently estimated at $1,309,617, approximately $447 per square foot. 89 Hobart St is a home located in Suffolk County with nearby schools including Boston Green Academy Horace Mann Charter School, St Columbkille Partnership School, and Shaloh House Jewish Day School.
Ownership History
Date
Name
Owned For
Owner Type
Purchase Details
Closed on
Jan 12, 1996
Sold by
Freeeman Regina A
Bought by
Obrien Thomas M and Obrien Flona T
Current Estimated Value
Home Financials for this Owner
Home Financials are based on the most recent Mortgage that was taken out on this home.
Original Mortgage
$209,000
Interest Rate
7.31%
Mortgage Type
Purchase Money Mortgage
Create a Home Valuation Report for This Property
The Home Valuation Report is an in-depth analysis detailing your home's value as well as a comparison with similar homes in the area
Home Values in the Area
Average Home Value in this Area
Purchase History
| Date | Buyer | Sale Price | Title Company |
|---|---|---|---|
| Obrien Thomas M | $220,000 | -- |
Source: Public Records
Mortgage History
| Date | Status | Borrower | Loan Amount |
|---|---|---|---|
| Open | Obrien Thomas M | $196,000 | |
| Closed | Obrien Thomas M | $220,000 | |
| Closed | Obrien Thomas M | $209,000 |
Source: Public Records
Tax History Compared to Growth
Tax History
| Year | Tax Paid | Tax Assessment Tax Assessment Total Assessment is a certain percentage of the fair market value that is determined by local assessors to be the total taxable value of land and additions on the property. | Land | Improvement |
|---|---|---|---|---|
| 2025 | $13,567 | $1,171,600 | $394,700 | $776,900 |
| 2024 | $12,265 | $1,125,200 | $330,800 | $794,400 |
| 2023 | $10,639 | $990,600 | $306,200 | $684,400 |
| 2022 | $10,073 | $925,800 | $286,200 | $639,600 |
| 2021 | $9,878 | $925,800 | $286,200 | $639,600 |
| 2020 | $9,696 | $918,200 | $255,200 | $663,000 |
| 2019 | $9,231 | $875,800 | $209,000 | $666,800 |
| 2018 | $8,655 | $825,900 | $209,000 | $616,900 |
| 2017 | $8,578 | $810,000 | $209,000 | $601,000 |
| 2016 | $7,955 | $723,200 | $209,000 | $514,200 |
| 2015 | $8,182 | $675,600 | $215,600 | $460,000 |
| 2014 | $7,260 | $577,100 | $215,600 | $361,500 |
Source: Public Records
Map
Nearby Homes
- 59 Riverview Rd
- 165 Bigelow St
- 21 Upcrest Rd
- 107 Bigelow St Unit 2
- 14 Converse St
- 300 Faneuil St
- 110 Bigelow St
- 357 Faneuil St Unit 12
- 77 Bennett St Unit 2
- 144 Newton St Unit 1
- 365 Faneuil St Unit 2
- 6 Harriet St
- 461 Washington St Unit 301
- 14 Atkins St
- 11 Faneuil St
- 8 Tremont Place
- 664 Washington St
- 36-38 Bostonia Ave
- 214 Market St Unit 405
- 214 Market St Unit 201
- 89 Hobart St Unit 2
- 91 Hobart St Unit 93
- 93 Hobart St Unit 2
- 93 Hobart St Unit 3
- 93 Hobart St
- 91 Hobart St Unit 1
- 19 Oliva Rd Unit 21
- 15 Oliva Rd Unit 17
- 15 Oliva Rd Unit 2
- 15 Oliva Rd Unit 1
- 90 Hobart St
- 90 Hobart St Unit 1
- 90 Hobart St
- 52 Brooks St Unit 54
- 56 Brooks St
- 56 Brooks St
- 56 Brooks St Unit x
- 88 Hobart St Unit 90
- 48 Brooks St
- 92 Hobart St Unit 94