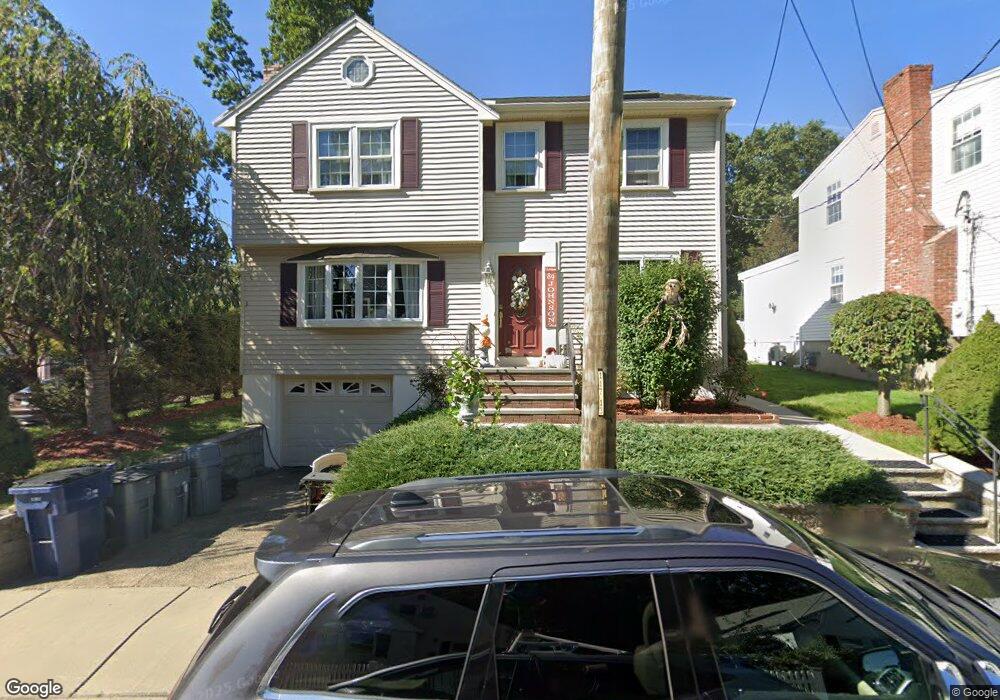
89 Johnson St West Roxbury, MA 02132
Upper Washington-Spring Street NeighborhoodEstimated Value: $713,000 - $1,011,000
3
Beds
2
Baths
1,305
Sq Ft
$608/Sq Ft
Est. Value
About This Home
This home is located at 89 Johnson St, West Roxbury, MA 02132 and is currently estimated at $793,371, approximately $607 per square foot. 89 Johnson St is a home located in Suffolk County with nearby schools including St Theresa School, Catholic Memorial School, and The Roxbury Latin School.
Ownership History
Date
Name
Owned For
Owner Type
Purchase Details
Closed on
Apr 23, 2019
Sold by
Keville Michael J and Keville Maria L
Bought by
Keville Ft
Current Estimated Value
Purchase Details
Closed on
Jan 29, 1993
Sold by
Joyce Paul F and Joyce Gloria A
Bought by
Keville Michael J and Keville Maria L
Create a Home Valuation Report for This Property
The Home Valuation Report is an in-depth analysis detailing your home's value as well as a comparison with similar homes in the area
Home Values in the Area
Average Home Value in this Area
Purchase History
| Date | Buyer | Sale Price | Title Company |
|---|---|---|---|
| Keville Ft | -- | -- | |
| Keville Michael J | $155,000 | -- |
Source: Public Records
Mortgage History
| Date | Status | Borrower | Loan Amount |
|---|---|---|---|
| Previous Owner | Keville Michael J | $396,000 | |
| Previous Owner | Keville Michael J | $264,000 | |
| Previous Owner | Keville Michael J | $263,000 |
Source: Public Records
Tax History Compared to Growth
Tax History
| Year | Tax Paid | Tax Assessment Tax Assessment Total Assessment is a certain percentage of the fair market value that is determined by local assessors to be the total taxable value of land and additions on the property. | Land | Improvement |
|---|---|---|---|---|
| 2025 | $6,870 | $593,300 | $180,100 | $413,200 |
| 2024 | $5,704 | $523,300 | $179,700 | $343,600 |
| 2023 | $5,620 | $523,300 | $179,700 | $343,600 |
| 2022 | $5,176 | $475,700 | $163,400 | $312,300 |
| 2021 | $4,717 | $442,100 | $155,600 | $286,500 |
| 2020 | $4,637 | $439,100 | $148,100 | $291,000 |
| 2019 | $4,368 | $414,400 | $123,500 | $290,900 |
| 2018 | $4,020 | $383,600 | $123,500 | $260,100 |
| 2017 | $4,020 | $379,600 | $123,500 | $256,100 |
| 2016 | $3,940 | $358,200 | $123,500 | $234,700 |
| 2015 | $4,125 | $340,600 | $144,800 | $195,800 |
| 2014 | $4,004 | $318,300 | $144,800 | $173,500 |
Source: Public Records
Map
Nearby Homes
- 63 Johnson St
- 12 Bronx Rd
- 2231 Centre St
- 80 Caledonian Ave
- 14 Sanborn Ave
- 27-29 Temple St
- 1214 Vfw Pkwy Unit 30
- 1214 Vfw Pkwy Unit 37
- 340 Baker St Unit 1
- 1515 Vfw Pkwy Unit M19
- 28 Dow Rd
- 55 Cottage Rd
- 46 Bayard St
- 348 Lagrange St
- 425 Lagrange St Unit 203
- 110 New Haven St
- 115 Grove St Unit 11
- 111 Grove St Unit 6
- 54 Sturges Rd
- 191 Glenellen Rd