K
Seller's Agent in 2023
Kerry D'Ambroise
Woodcastle Realty
(603) 864-8115
1 in this area
10 Total Sales

Estimated Value: $426,000 - $525,000
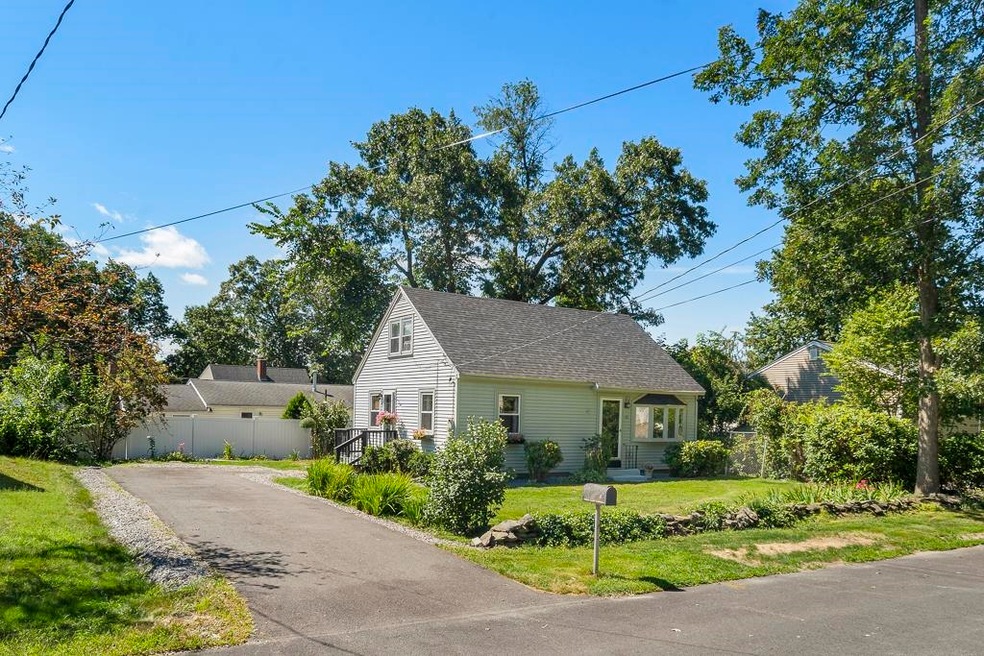
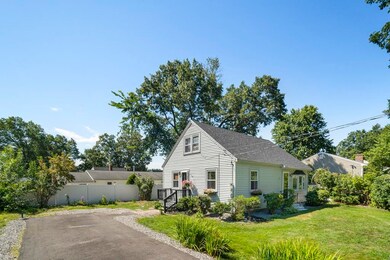
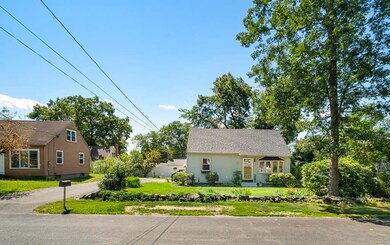
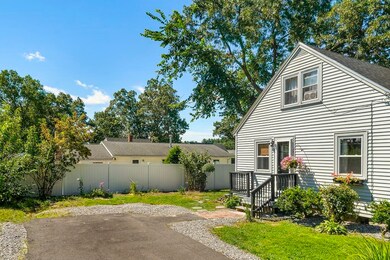
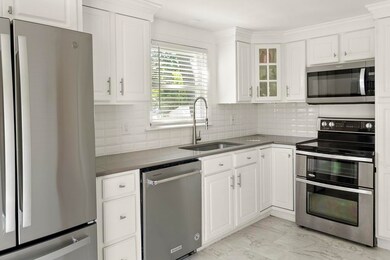
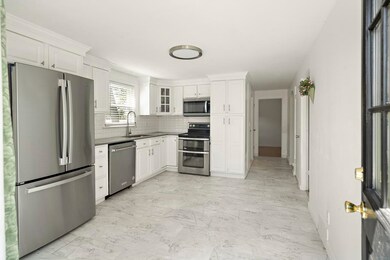
Looking for a charming cape in Nashua? Look no further than 89 Linton Street. This cape is a 3 bedroom plus office with 1 bathroom. All new appliances outfit the kitchen and don't forget the backyard where you will find your own private patio! This home has an ability to be utilized in a variety of ways come check it out for yourself today!
Last Agent to Sell the Property
Woodcastle Realty License #077701 Listed on: 08/16/2023
| Date | Buyer | Sale Price | Title Company |
|---|---|---|---|
| Bradford Thomas | $385,000 | None Available | |
| Piercy Timothy J | $2,000 | -- |
| Date | Status | Borrower | Loan Amount |
|---|---|---|---|
| Open | Bradford Thomas | $335,750 |
| Date | Event | Price | List to Sale | Price per Sq Ft |
|---|---|---|---|---|
| 10/30/2023 10/30/23 | Sold | $385,000 | +4.1% | $346 / Sq Ft |
| 08/19/2023 08/19/23 | Pending | -- | -- | -- |
| 08/16/2023 08/16/23 | For Sale | $369,999 | -- | $332 / Sq Ft |
| Year | Tax Paid | Tax Assessment Tax Assessment Total Assessment is a certain percentage of the fair market value that is determined by local assessors to be the total taxable value of land and additions on the property. | Land | Improvement |
|---|---|---|---|---|
| 2024 | $6,031 | $379,300 | $138,700 | $240,600 |
| 2023 | $5,660 | $310,500 | $111,000 | $199,500 |
| 2022 | $5,611 | $310,500 | $111,000 | $199,500 |
| 2021 | $4,916 | $211,700 | $77,700 | $134,000 |
| 2020 | $4,764 | $210,700 | $77,700 | $133,000 |
| 2019 | $4,585 | $210,700 | $77,700 | $133,000 |
| 2018 | $4,469 | $210,700 | $77,700 | $133,000 |
| 2017 | $3,729 | $144,600 | $68,400 | $76,200 |
| 2016 | $3,625 | $144,600 | $68,400 | $76,200 |
| 2015 | $3,547 | $144,600 | $68,400 | $76,200 |
| 2014 | $3,478 | $144,600 | $68,400 | $76,200 |
K
Seller's Agent in 2023
Kerry D'Ambroise
Woodcastle Realty
(603) 864-8115
1 in this area
10 Total Sales

Buyer's Agent in 2023
Michelle Soucy
Keller Williams Gateway Realty
(603) 566-1809
3 in this area
116 Total Sales
Source: PrimeMLS
MLS Number: 4965858
APN: NASH-000129-000000-000212
Disclaimer: Certain information contained herein is derived from information provided by parties other than Homes.com. All information provided is deemed reliable, but is not guaranteed to be accurate and should be independently verified.
![]() Copyright 2025 PrimeMLS, Inc. All rights reserved. This information is deemed reliable, but not guaranteed. The data relating to real estate displayed on this display comes in part from the IDX Program of PrimeMLS. The information being provided is for consumers’ personal, non-commercial use and may not be used for any purpose other than to identify prospective properties consumers may be interested in purchasing.
Copyright 2025 PrimeMLS, Inc. All rights reserved. This information is deemed reliable, but not guaranteed. The data relating to real estate displayed on this display comes in part from the IDX Program of PrimeMLS. The information being provided is for consumers’ personal, non-commercial use and may not be used for any purpose other than to identify prospective properties consumers may be interested in purchasing.