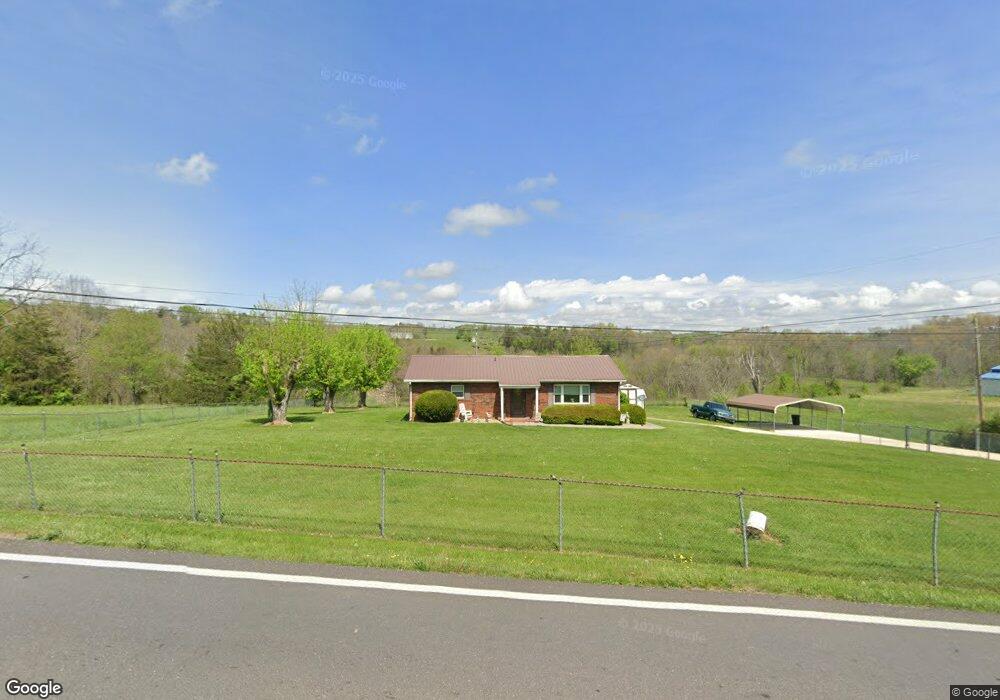
890 Cedar Fork Rd Tazewell, TN 37879
Estimated Value: $144,000 - $214,000
--
Bed
2
Baths
1,385
Sq Ft
$138/Sq Ft
Est. Value
About This Home
This home is located at 890 Cedar Fork Rd, Tazewell, TN 37879 and is currently estimated at $191,149, approximately $138 per square foot. 890 Cedar Fork Rd is a home located in Claiborne County.
Ownership History
Date
Name
Owned For
Owner Type
Purchase Details
Closed on
Feb 26, 2008
Sold by
Carter Ralph D
Bought by
Goins Paula S
Current Estimated Value
Home Financials for this Owner
Home Financials are based on the most recent Mortgage that was taken out on this home.
Original Mortgage
$100,000
Outstanding Balance
$61,930
Interest Rate
5.63%
Estimated Equity
$129,219
Purchase Details
Closed on
May 27, 2003
Sold by
Wilson Albert
Bought by
Carter Ralph D
Purchase Details
Closed on
Jan 30, 1998
Sold by
Albert Wilson
Bought by
England Donald
Purchase Details
Closed on
Nov 1, 1993
Sold by
Taylor Lawrence G
Bought by
Labert Wilson
Purchase Details
Closed on
Sep 25, 1992
Bought by
Taylor Alwrence G and Taylor Ada
Purchase Details
Closed on
Jun 3, 1987
Bought by
Runions Betty Lou
Purchase Details
Closed on
Jan 1, 1985
Bought by
Runions Betty Lou and Angela Dawn
Purchase Details
Closed on
Jan 2, 1975
Purchase Details
Closed on
Jan 3, 1971
Create a Home Valuation Report for This Property
The Home Valuation Report is an in-depth analysis detailing your home's value as well as a comparison with similar homes in the area
Home Values in the Area
Average Home Value in this Area
Purchase History
| Date | Buyer | Sale Price | Title Company |
|---|---|---|---|
| Goins Paula S | $100,000 | -- | |
| Carter Ralph D | $65,500 | -- | |
| England Donald | $27,000 | -- | |
| Labert Wilson | $60,000 | -- | |
| Taylor Alwrence G | $52,500 | -- | |
| Runions Betty Lou | -- | -- | |
| Runions Betty Lou | -- | -- | |
| -- | -- | -- | |
| -- | -- | -- |
Source: Public Records
Mortgage History
| Date | Status | Borrower | Loan Amount |
|---|---|---|---|
| Open | Not Available | $100,000 |
Source: Public Records
Tax History Compared to Growth
Tax History
| Year | Tax Paid | Tax Assessment Tax Assessment Total Assessment is a certain percentage of the fair market value that is determined by local assessors to be the total taxable value of land and additions on the property. | Land | Improvement |
|---|---|---|---|---|
| 2024 | $583 | $24,900 | $2,500 | $22,400 |
| 2023 | $583 | $24,900 | $2,500 | $22,400 |
| 2022 | $498 | $24,900 | $2,500 | $22,400 |
| 2021 | $435 | $16,875 | $2,325 | $14,550 |
| 2020 | $435 | $16,875 | $2,325 | $14,550 |
| 2019 | $435 | $16,875 | $2,325 | $14,550 |
| 2018 | $435 | $16,875 | $2,325 | $14,550 |
| 2017 | $435 | $16,875 | $2,325 | $14,550 |
| 2016 | $493 | $19,100 | $3,450 | $15,650 |
| 2015 | $474 | $19,100 | $3,450 | $15,650 |
| 2014 | $474 | $19,088 | $0 | $0 |
Source: Public Records
Map
Nearby Homes
- 0 Tbd Cedar Fork Rd
- L-2 Cedar Fork Rd
- 159 Emory Ln
- 328 Wilson Hurst St
- 404 Cedar Fork Rd
- 330 Wilson Hurst St
- 430 Mcvey Rd
- 326 Wilson Hurst St
- 323 Wilson Hurst St
- 0 Windward Blvd Unit 1311003
- 0 Windward Blvd Unit 1306996
- 1934 Ball St
- 5.74 acres Bailey Cemetary Rd
- 5.74 acres Bailey Cemetery Rd
- 158 Dudley Cir
- 136 Dudley Ln
- 201 Henley St
- 0 Bailey Cemetery Rd Unit 1311109
- 141 Henley St
- 127 Henley St
- 885 Cedar Fork Rd
- 928 Cedar Fork Rd
- 853 Cedar Fork Rd
- L1-2 Cedar Fork Rd
- 824 Cedar Fork Rd
- 115 Carter Ln
- 156 Carter Ln
- 170 Carter Ln
- 751 Cedar Fork Rd
- 728 Cedar Fork Rd
- 745 Cedar Fork Rd
- 320 Carter Ln
- 695 Mcvey Rd
- 681 Mcvey Rd
- 696 Mcvey Rd
- 329 Carter Ln
- 351 Carter Ln
- 376 Carter Ln
- 623 Mcvey Rd
- 0 Cox Creek Ln Unit 783316