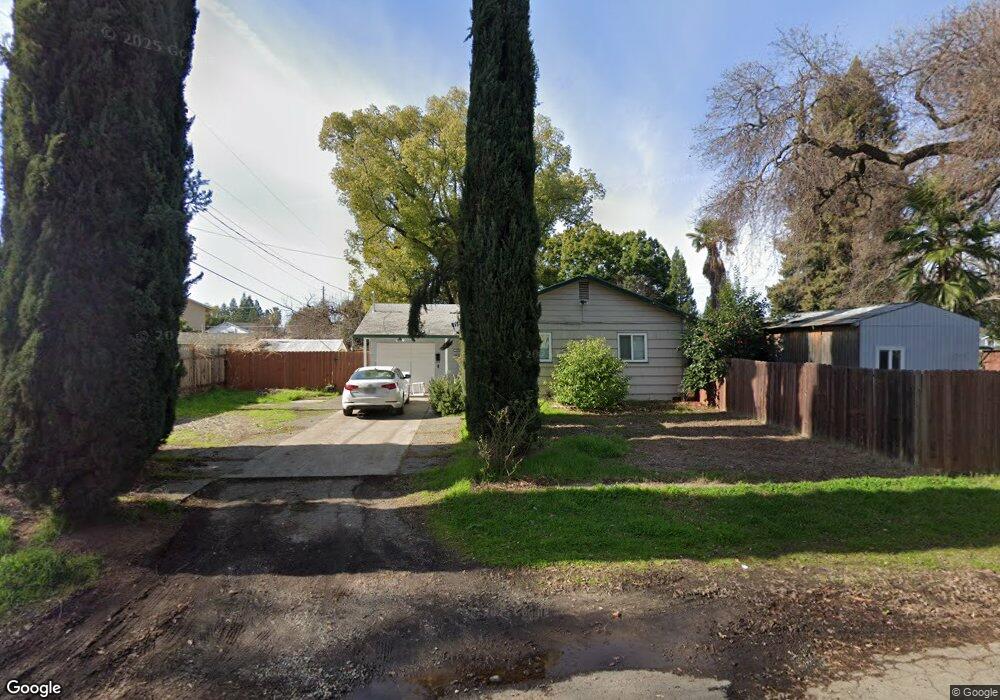
8900 Oro Way Orangevale, CA 95662
Estimated Value: $304,000 - $529,000
3
Beds
1
Bath
1,207
Sq Ft
$359/Sq Ft
Est. Value
About This Home
This home is located at 8900 Oro Way, Orangevale, CA 95662 and is currently estimated at $433,295, approximately $358 per square foot. 8900 Oro Way is a home located in Sacramento County with nearby schools including Pershing Elementary School, Andrew Carnegie Middle School, and Bella Vista High School.
Ownership History
Date
Name
Owned For
Owner Type
Purchase Details
Closed on
Oct 8, 2015
Sold by
Manning Taylor Anne Calvillo
Bought by
Manning Taylor Anne Calvillo and Taylor Anne Calvillo Manning R
Current Estimated Value
Purchase Details
Closed on
Jun 3, 2014
Sold by
Calvillo Pauline A and Cavillo Pauline A
Bought by
Calvillo Pauline A and Calvillo Revocable T Pauline A
Purchase Details
Closed on
Aug 10, 1999
Sold by
Aguayo Esther and Carrillo Oscar L
Bought by
Cavillo Pauline A
Home Financials for this Owner
Home Financials are based on the most recent Mortgage that was taken out on this home.
Original Mortgage
$106,845
Outstanding Balance
$30,824
Interest Rate
7.7%
Mortgage Type
VA
Estimated Equity
$402,471
Purchase Details
Closed on
Nov 25, 1998
Sold by
Aguayo Esther
Bought by
Aguayo Esther and Carrillo Oscar L
Create a Home Valuation Report for This Property
The Home Valuation Report is an in-depth analysis detailing your home's value as well as a comparison with similar homes in the area
Home Values in the Area
Average Home Value in this Area
Purchase History
| Date | Buyer | Sale Price | Title Company |
|---|---|---|---|
| Manning Taylor Anne Calvillo | -- | None Available | |
| Manning Taylor Anne Calvillo | -- | None Available | |
| Calvillo Pauline A | -- | None Available | |
| Cavillo Pauline A | $105,000 | Chicago Title Co | |
| Aguayo Esther | -- | -- | |
| Aguayo Esther | -- | -- |
Source: Public Records
Mortgage History
| Date | Status | Borrower | Loan Amount |
|---|---|---|---|
| Open | Cavillo Pauline A | $106,845 |
Source: Public Records
Tax History Compared to Growth
Tax History
| Year | Tax Paid | Tax Assessment Tax Assessment Total Assessment is a certain percentage of the fair market value that is determined by local assessors to be the total taxable value of land and additions on the property. | Land | Improvement |
|---|---|---|---|---|
| 2025 | $1,953 | $161,359 | $39,951 | $121,408 |
| 2024 | $1,953 | $158,196 | $39,168 | $119,028 |
| 2023 | $1,905 | $155,095 | $38,400 | $116,695 |
| 2022 | $1,895 | $152,055 | $37,648 | $114,407 |
| 2021 | $1,864 | $149,074 | $36,910 | $112,164 |
| 2020 | $1,831 | $147,546 | $36,532 | $111,014 |
| 2019 | $1,795 | $144,654 | $35,816 | $108,838 |
| 2018 | $1,775 | $141,818 | $35,114 | $106,704 |
| 2017 | $1,758 | $139,038 | $34,426 | $104,612 |
| 2016 | $1,645 | $136,312 | $33,751 | $102,561 |
| 2015 | $1,536 | $134,266 | $33,245 | $101,021 |
| 2014 | $1,504 | $131,637 | $32,594 | $99,043 |
Source: Public Records
Map
Nearby Homes
- 8900 Rico Ct
- 8844 Canarsie Ave
- 6000 Cowden Ct
- 5817 Husker St
- 5810 Hazel Ave
- 8878 Nimbus Way
- 8906 Aksarben Dr
- 6103 Passiflora Ln
- 8868 Pershing Ave
- 8856 Venikov Place
- 5933 Filbert Ave
- 8754 Springhills Way
- 8905 Leedy Ln
- 8677 Robin Hill Way
- 6422 Hazel Ave
- 8849 Britland Way
- 9058 Leedy Ln
- 8637 Monica Ave
- 8650 Blythe Ave
- 6600 Rosa Prado Ct
- 8904 Fortuna Way
- 8909 Rico Ct
- 8912 Fortuna Way
- 8905 Rico Ct
- 6030 Hazel Ave
- 6024 Hazel Ave
- 8905 Oro Way
- 8916 Fortuna Way
- 6016 Hazel Ave
- 8905 Fortuna Way
- 6040 Hazel Ave
- 8909 Fortuna Way
- 8901 Rico Ct
- 8913 Fortuna Way
- 6010 Hazel Ave
- 8908 Oro Way
- 8909 Oro Way
- 8920 Fortuna Way
- 8917 Fortuna Way
- 8904 Rico Ct