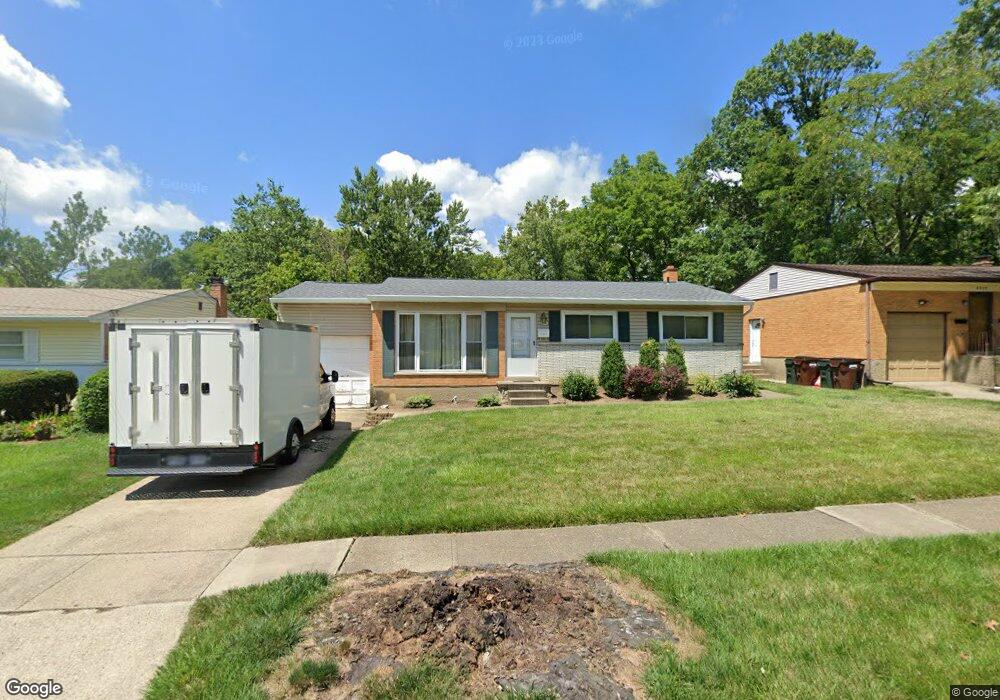
8901 Mockingbird Ln Cincinnati, OH 45231
Finneytown NeighborhoodEstimated Value: $194,000 - $234,000
3
Beds
1
Bath
1,160
Sq Ft
$183/Sq Ft
Est. Value
About This Home
This home is located at 8901 Mockingbird Ln, Cincinnati, OH 45231 and is currently estimated at $212,752, approximately $183 per square foot. 8901 Mockingbird Ln is a home located in Hamilton County with nearby schools including Finneytown Elementary School, Finneytown Secondary Campus, and St. Vivian School.
Ownership History
Date
Name
Owned For
Owner Type
Purchase Details
Closed on
Nov 5, 2021
Sold by
Frey Amy M
Bought by
Frey Jeffrey T
Current Estimated Value
Purchase Details
Closed on
Dec 31, 1998
Sold by
Gude Kerry A and Gude Kerry A
Bought by
Frey Jeffrey T and Frey Amy H
Home Financials for this Owner
Home Financials are based on the most recent Mortgage that was taken out on this home.
Original Mortgage
$86,912
Outstanding Balance
$20,489
Interest Rate
6.95%
Mortgage Type
FHA
Estimated Equity
$192,263
Purchase Details
Closed on
Jun 23, 1997
Sold by
Sump Jerry W and Sump Penny L
Bought by
Gude Kerry A
Home Financials for this Owner
Home Financials are based on the most recent Mortgage that was taken out on this home.
Original Mortgage
$75,050
Interest Rate
8%
Create a Home Valuation Report for This Property
The Home Valuation Report is an in-depth analysis detailing your home's value as well as a comparison with similar homes in the area
Home Values in the Area
Average Home Value in this Area
Purchase History
| Date | Buyer | Sale Price | Title Company |
|---|---|---|---|
| Frey Jeffrey T | -- | None Available | |
| Frey Jeffrey T | $87,000 | -- | |
| Gude Kerry A | $79,000 | Longworth Title Agency Inc |
Source: Public Records
Mortgage History
| Date | Status | Borrower | Loan Amount |
|---|---|---|---|
| Open | Frey Jeffrey T | $86,912 | |
| Previous Owner | Gude Kerry A | $75,050 |
Source: Public Records
Tax History Compared to Growth
Tax History
| Year | Tax Paid | Tax Assessment Tax Assessment Total Assessment is a certain percentage of the fair market value that is determined by local assessors to be the total taxable value of land and additions on the property. | Land | Improvement |
|---|---|---|---|---|
| 2024 | $3,676 | $53,974 | $12,243 | $41,731 |
| 2023 | $3,614 | $53,974 | $12,243 | $41,731 |
| 2022 | $3,447 | $37,339 | $12,086 | $25,253 |
| 2021 | $3,382 | $37,339 | $12,086 | $25,253 |
| 2020 | $3,437 | $37,339 | $12,086 | $25,253 |
| 2019 | $3,155 | $31,640 | $10,241 | $21,399 |
| 2018 | $2,913 | $31,640 | $10,241 | $21,399 |
| 2017 | $2,776 | $31,640 | $10,241 | $21,399 |
| 2016 | $2,673 | $29,940 | $10,574 | $19,366 |
| 2015 | $2,690 | $29,940 | $10,574 | $19,366 |
| 2014 | $2,692 | $29,940 | $10,574 | $19,366 |
| 2013 | $2,741 | $31,514 | $11,130 | $20,384 |
Source: Public Records
Map
Nearby Homes
- 1100 Gracewind Ct
- 1101 Meadowind Ct
- 8965 Fontainebleau Terrace
- 8693 Mockingbird Ln
- 8925 Monsanto Dr
- 1125 Murkett Ct
- 954 Hollytree Dr
- 1052 Vacationland Dr
- 1190 Sugartree Ct
- 8663 Mockingbird Ln
- 1116 Madeleine Cir
- 8950 Daly Rd
- 1013 Vacationland Dr
- 8622 Mockingbird Ln
- 8627 Mockingbird Ln
- 8831 Daly Rd
- 1037 Lost Crossing
- 8584 Mockingbird Ln
- 993 Lost Crossing
- 8772 Balboa Dr
- 8891 Mockingbird Ln
- 8909 Mockingbird Ln
- 8883 Mockingbird Ln
- 8919 Mockingbird Ln
- 8906 Mockingbird Ln
- 8873 Mockingbird Ln
- 8927 Mockingbird Ln
- 8886 Mockingbird Ln
- 8865 Mockingbird Ln
- 8937 Mockingbird Ln
- 8935 Cottonwood Dr
- 8876 Mockingbird Ln
- 8921 Cottonwood Dr
- 8911 Cottonwood Dr
- 8901 Cottonwood Dr
- 8868 Mockingbird Ln
- 8855 Mockingbird Ln
- 8943 Mockingbird Ln
- 8891 Cottonwood Dr
- 8860 Mockingbird Ln