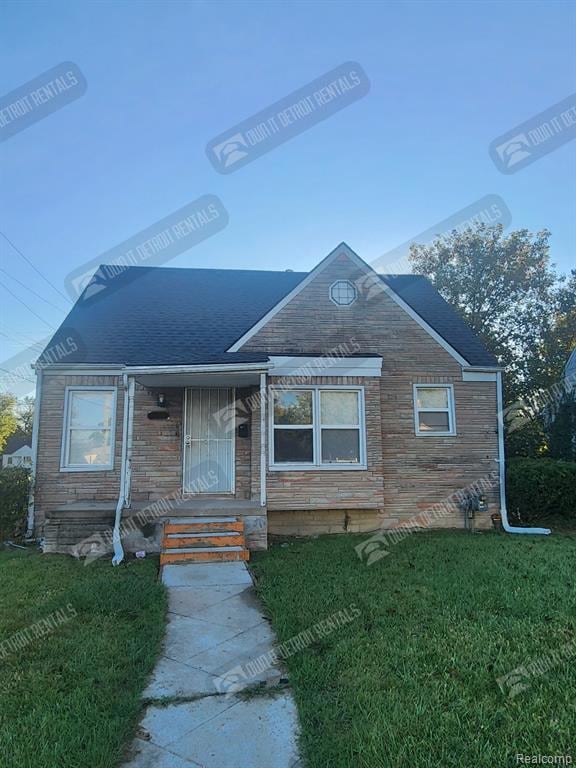


8908 Burt Rd Detroit, MI 48228
Franklin Park NeighborhoodHighlights
- Ground Level Unit
- No HOA
- Forced Air Heating System
- Cass Technical High School Rated 10
- Bungalow
About This Home
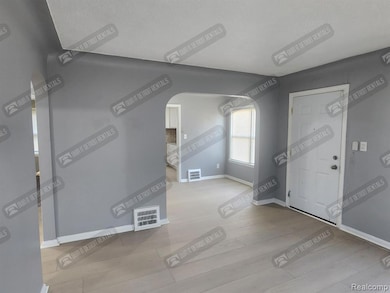
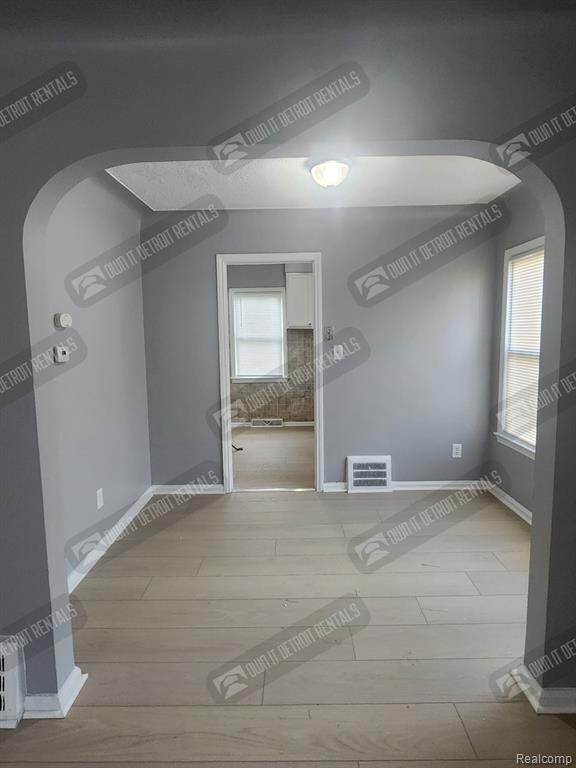
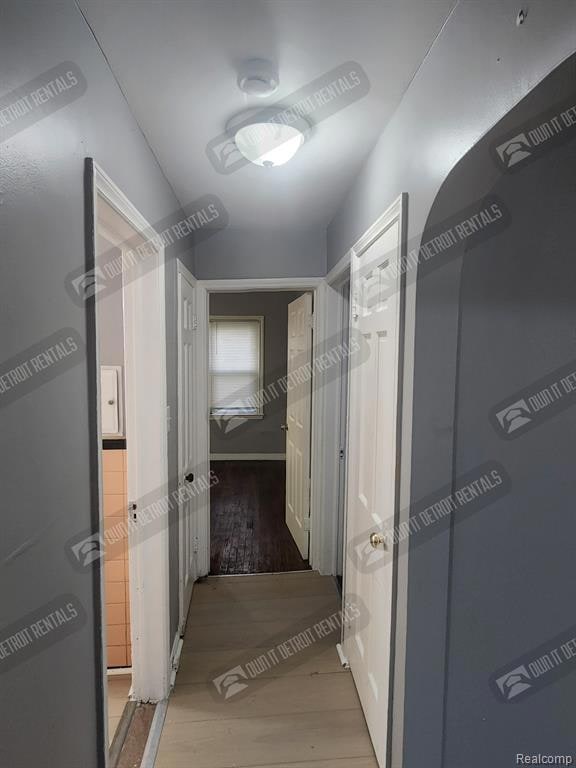
**SECTION 8 ACCEPTED. This lovely brick bungalow comes with 3 bedrooms and 1 bathroom. There are stunning hardwood floors throughout the home as well as the upstairs bedroom. There is a very clean basement that is great for storage and activities.

Home Details
Home Type
- Single Family
Est. Annual Taxes
- $1,391
Year Built
- Built in 1942
Lot Details
- 6,970 Sq Ft Lot
- Lot Dimensions are 55x126
Home Design
- Bungalow
- Brick Exterior Construction
- Brick Foundation
Interior Spaces
- 1,050 Sq Ft Home
- 1.5-Story Property
- Partially Finished Basement
Bedrooms and Bathrooms
- 3 Bedrooms
- 1 Full Bathroom
Location
- Ground Level Unit
Utilities
- Forced Air Heating System
- Heating System Uses Natural Gas
Community Details
- No Home Owners Association
- Rouge Park Blvd Sub Subdivision
Listing and Financial Details
- Security Deposit $1,680
- 12 Month Lease Term
- Application Fee: 50.00
- Assessor Parcel Number W22I107346S
Map
Source: Realcomp
MLS Number: 20251050073
APN: 22-107346
Disclaimer: Certain information contained herein is derived from information provided by parties other than Homes.com. All information provided is deemed reliable, but is not guaranteed to be accurate and should be independently verified.
![]() IDX provided courtesy of Realcomp II Ltd. via Ten-X and MLS
IDX provided courtesy of Realcomp II Ltd. via Ten-X and MLS
Copyright 2025 Realcomp II Ltd. Shareholders
IDX information is provided exclusively for consumers' personal, noncommercial use and may not be used for any purpose other than to identify prospective properties consumers may be interested in purchasing. The accuracy of all information, regardless of source, is not guaranteed or warranted. All information should be independently verified.
Listing Information presented by local MLS brokerage: Ten-X, local REALTOR®- Arlene Richardson - (888)-952-6393
- 8909 Burt Rd
- 8873 Burt Rd
- 9012 Pierson St
- 8845 Pierson St
- 9028 Trinity St
- 9035 Braile St
- 8674 Pierson St
- 9208 Braile St
- 8634 Burt Rd
- 9253 Pierson St
- 8620 Pierson St
- 9091 Fielding St
- 8601 Burt Rd
- 8855 Stout St
- 8682 Fielding St
- 9099 Stout St
- 9107 Stout St
- 8458 Pierson St
- 9207 Stout St
- 9252 Fielding St
- 9327 Fielding St
- 20611 W Chicago St
- 9255 Heyden St
- 8236 Pierson St
- 8841 Auburn St
- 8442 Auburn St
- 20221 Tireman Ave
- 9961 Vaughan St
- 7795 Heyden St
- 8257 Minock St
- 19449 W Chicago St
- 11315 Vaughan St
- 7416 Pierson St
- 7635 Evergreen Rd
- 11652 Fielding St
- 8900 Artesian St
- 9046 Stahelin Ave
- 8651 Hazelton St
- 8109 Hazelton St
- 14 Eden Park Dr