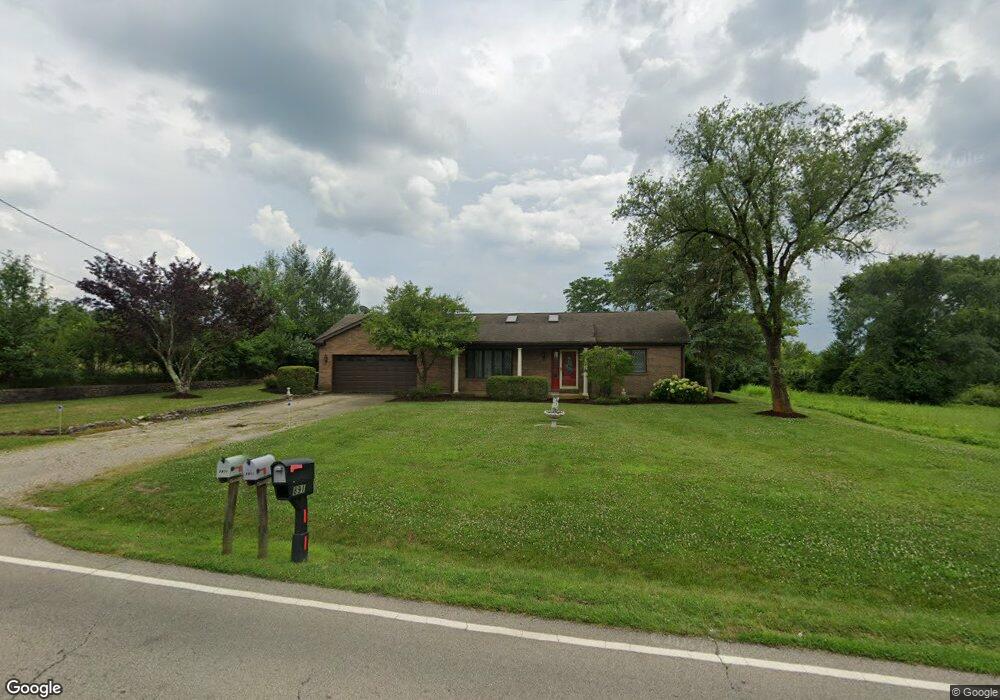
8911 Chamberlain Rd Franklin, OH 45005
Estimated Value: $271,000 - $363,000
3
Beds
2
Baths
1,665
Sq Ft
$188/Sq Ft
Est. Value
About This Home
This home is located at 8911 Chamberlain Rd, Franklin, OH 45005 and is currently estimated at $312,311, approximately $187 per square foot. 8911 Chamberlain Rd is a home located in Warren County with nearby schools including Alden R Brown Elementary School, Chamberlain Middle School, and Carlisle High School.
Ownership History
Date
Name
Owned For
Owner Type
Purchase Details
Closed on
Oct 16, 2013
Sold by
Estate Of Lillian E Mack
Bought by
Mack Beverly S
Current Estimated Value
Purchase Details
Closed on
Dec 20, 2004
Sold by
Mack Lillian E
Bought by
Mack Lillian E and Mack Beverly S
Home Financials for this Owner
Home Financials are based on the most recent Mortgage that was taken out on this home.
Original Mortgage
$268,500
Interest Rate
4.1%
Mortgage Type
FHA
Purchase Details
Closed on
Dec 18, 2004
Sold by
Mack Beverly S
Bought by
Mack Lillian E
Home Financials for this Owner
Home Financials are based on the most recent Mortgage that was taken out on this home.
Original Mortgage
$268,500
Interest Rate
4.1%
Mortgage Type
FHA
Purchase Details
Closed on
Jul 28, 1981
Sold by
Mack Mack and Mack Richard J
Create a Home Valuation Report for This Property
The Home Valuation Report is an in-depth analysis detailing your home's value as well as a comparison with similar homes in the area
Home Values in the Area
Average Home Value in this Area
Purchase History
| Date | Buyer | Sale Price | Title Company |
|---|---|---|---|
| Mack Beverly S | -- | Riverbend Commercial Title L | |
| Mack Lillian E | -- | -- | |
| Mack Lillian E | -- | -- | |
| -- | -- | -- |
Source: Public Records
Mortgage History
| Date | Status | Borrower | Loan Amount |
|---|---|---|---|
| Previous Owner | Mack Lillian E | $268,500 | |
| Closed | Mack Lillian E | $268,500 |
Source: Public Records
Tax History Compared to Growth
Tax History
| Year | Tax Paid | Tax Assessment Tax Assessment Total Assessment is a certain percentage of the fair market value that is determined by local assessors to be the total taxable value of land and additions on the property. | Land | Improvement |
|---|---|---|---|---|
| 2024 | $3,413 | $90,580 | $21,510 | $69,070 |
| 2023 | $2,875 | $69,849 | $11,035 | $58,814 |
| 2022 | $2,861 | $69,850 | $11,036 | $58,814 |
| 2021 | $2,760 | $69,850 | $11,036 | $58,814 |
| 2020 | $2,675 | $59,196 | $9,352 | $49,844 |
| 2019 | $2,711 | $59,196 | $9,352 | $49,844 |
| 2018 | $2,307 | $59,196 | $9,352 | $49,844 |
| 2017 | $2,261 | $54,303 | $8,722 | $45,581 |
| 2016 | $1,966 | $54,303 | $8,722 | $45,581 |
| 2015 | $1,970 | $54,303 | $8,722 | $45,581 |
| 2014 | $1,690 | $47,640 | $7,650 | $39,980 |
| 2013 | $1,684 | $58,210 | $9,350 | $48,860 |
Source: Public Records
Map
Nearby Homes
- 10071 Eby Rd
- 7916 Middletown Germantown Rd
- 7962 Middletown Germantown Rd
- 8211 Sue Ave
- 8007 Martz Paulin Rd
- 7803 Lyn Dr
- 7721 Lyn Dr
- 7331 Pinewood Dr
- 8680 Plum Creek Ct
- 9675 Germantown Middletown Pike
- 8508 Thomas Rd
- 180 Vernon Place
- 7311 Beth Ct
- 355 Ethelrob Cir
- 1020 Dubois Rd
- 391 Sunset Dr
- 285 Nikki Ct
- 7885 Timberview Ct
- 7836 Timberwind Trail
- 102 Wolf Creek Ct
- 8935 Chamberlain Rd
- 8947 Chamberlain Rd
- 8934 Chamberlain Rd
- 8948 Chamberlain Rd
- 8956 Chamberlain Rd
- 8972 Franklin Madison Rd
- 8944 Franklin Madison Rd
- 9067 Leichty St
- 8834 Chamberlain Rd
- 8834 Chamberlain Rd
- 0 Franklin Madison Rd Unit 1264040
- 0 Franklin Madison Rd Unit 587062
- 8912 Franklin Madison Rd
- 9034 Franklin Madison Rd
- 9044 Franklin Madison Rd
- 9056 Franklin Madison Rd
- 8822 Chamberlain Rd
- 9074 Leichty St
- 9089 Leichty St
- 9066 Franklin Madison Rd