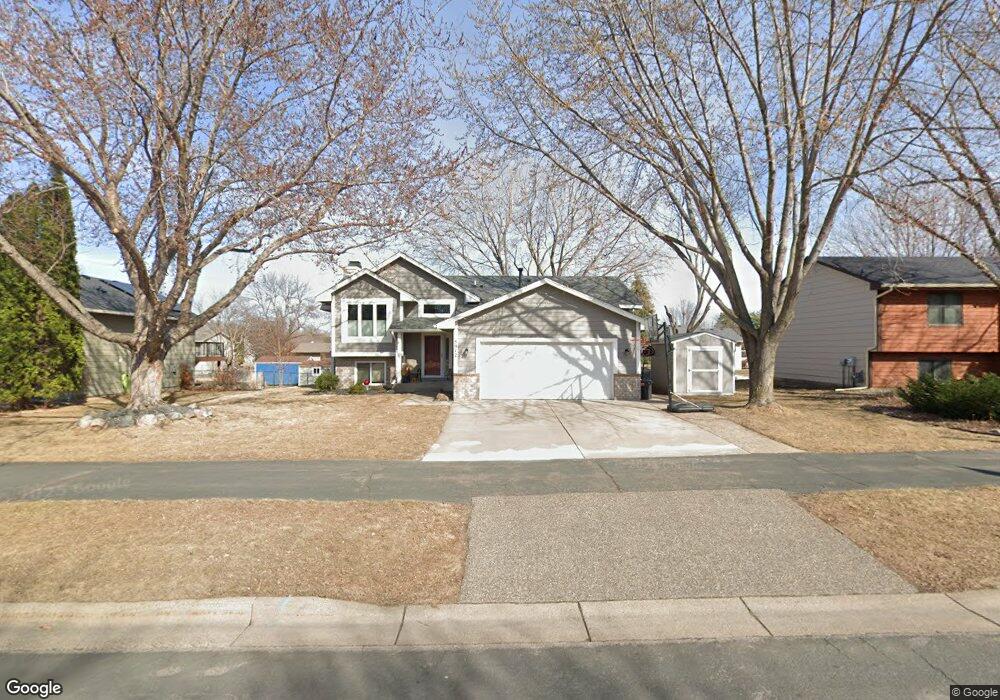
8912 Pineview Ln N Maple Grove, MN 55369
Estimated Value: $420,862 - $454,000
4
Beds
3
Baths
1,265
Sq Ft
$346/Sq Ft
Est. Value
About This Home
This home is located at 8912 Pineview Ln N, Maple Grove, MN 55369 and is currently estimated at $437,716, approximately $346 per square foot. 8912 Pineview Ln N is a home located in Hennepin County with nearby schools including Rice Lake Elementary School, Osseo Middle School, and Maple Grove Senior High School.
Ownership History
Date
Name
Owned For
Owner Type
Purchase Details
Closed on
Jul 10, 2009
Sold by
Bank Of America National Assoc
Bought by
Fischer Steven and Vande Kieft Renae
Current Estimated Value
Purchase Details
Closed on
Sep 29, 2006
Sold by
Scott Bradley A and Scott Beth A
Bought by
Ladino Maria A
Purchase Details
Closed on
Mar 27, 2006
Sold by
Us Bank Na
Bought by
Scott Bradley A and Scott Beth A
Purchase Details
Closed on
Jun 2, 2004
Sold by
Campbell John and Campbell Carolyn
Bought by
Mueller Jeffrey D
Purchase Details
Closed on
Feb 19, 2004
Sold by
River Run Properties Llc
Bought by
Campbell John
Create a Home Valuation Report for This Property
The Home Valuation Report is an in-depth analysis detailing your home's value as well as a comparison with similar homes in the area
Home Values in the Area
Average Home Value in this Area
Purchase History
| Date | Buyer | Sale Price | Title Company |
|---|---|---|---|
| Fischer Steven | $223,000 | -- | |
| Ladino Maria A | $287,500 | -- | |
| Scott Bradley A | $210,000 | -- | |
| Mueller Jeffrey D | $282,500 | -- | |
| Campbell John | $285,000 | -- |
Source: Public Records
Tax History Compared to Growth
Tax History
| Year | Tax Paid | Tax Assessment Tax Assessment Total Assessment is a certain percentage of the fair market value that is determined by local assessors to be the total taxable value of land and additions on the property. | Land | Improvement |
|---|---|---|---|---|
| 2024 | $4,916 | $387,100 | $105,000 | $282,100 |
| 2023 | $5,144 | $411,300 | $115,700 | $295,600 |
| 2022 | $4,386 | $418,700 | $106,300 | $312,400 |
| 2021 | $4,173 | $340,300 | $78,100 | $262,200 |
| 2020 | $4,275 | $318,900 | $63,900 | $255,000 |
| 2019 | $4,295 | $311,500 | $70,000 | $241,500 |
| 2018 | $3,911 | $296,900 | $66,000 | $230,900 |
| 2017 | $3,972 | $260,400 | $63,000 | $197,400 |
| 2016 | $3,841 | $248,900 | $59,000 | $189,900 |
| 2015 | $3,835 | $242,500 | $64,600 | $177,900 |
| 2014 | -- | $214,500 | $53,600 | $160,900 |
Source: Public Records
Map
Nearby Homes
- 12509 88th Ave N
- 12769 88th Ave N
- 8949 Rosewood Ln N
- 8735 Rosewood Ln N
- 12599 91st Place N
- 9061 Underwood Ln N
- 9132 Kirkwood Ln N
- 13351 90th Place N
- 9146 Ives Ln N
- 12598 84th Place N
- 11760 88th Place N
- 9323 Magnolia Ln N
- 13590 89th Ave N
- 9323 Kirkwood Ln N
- 9311 Kirkwood Ln N
- 9058 Goldenrod Ln N
- 8399 Norwood Ln N
- 12989 84th Ave N
- 11879 85th Place N Unit 54
- 8326 Oakview Ct N
- 8918 Pineview Ln N
- 8904 Pineview Ln N
- 8909 Oakview Ln N
- 8917 Oakview Ln N
- 8901 Oakview Ln N
- 8924 Pineview Ln N
- 8925 Oakview Ln N
- 8909 Pineview Ln N
- 8915 Pineview Ln N
- 8903 Pineview Ln N
- 8930 Pineview Ln N
- 8921 Pineview Ln N
- 8933 Oakview Ln N
- 8927 Pineview Ln N
- 8914 Oakview Ln N
- 8912 Oakview Ln N
- 8910 Quinwood Ln N
- 8936 Pineview Ln N
- 8916 Quinwood Ln N
- 8900 Quinwood Ln N