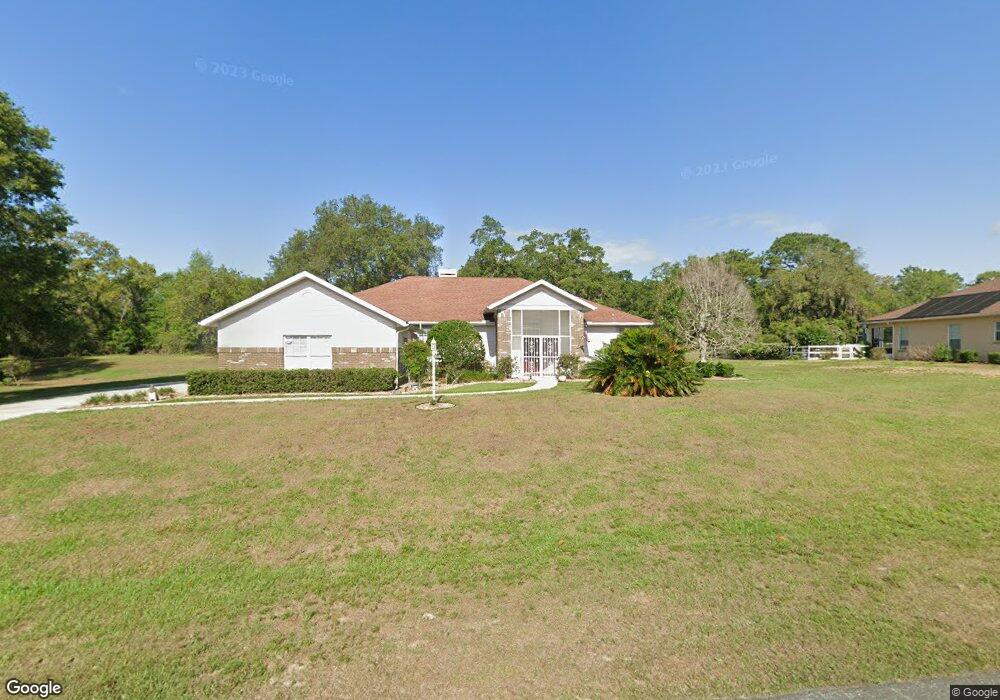
892 N Cherry Pop Dr Inverness, FL 34453
Estimated Value: $369,549 - $529,000
3
Beds
2
Baths
2,116
Sq Ft
$202/Sq Ft
Est. Value
About This Home
This home is located at 892 N Cherry Pop Dr, Inverness, FL 34453 and is currently estimated at $427,887, approximately $202 per square foot. 892 N Cherry Pop Dr is a home located in Citrus County with nearby schools including Hernando Elementary School, Inverness Middle School, and Citrus High School.
Ownership History
Date
Name
Owned For
Owner Type
Purchase Details
Closed on
Oct 13, 2017
Sold by
Vertenten Jeffrey R and Vertenten Lois A
Bought by
Vertenten Jeffrey R and Vertenten Lois A
Current Estimated Value
Purchase Details
Closed on
Jun 27, 2003
Sold by
Gosselin Robert A and Gosselin Rosalie
Bought by
Vertenten Jeffrey R and Vertenten Lois A
Purchase Details
Closed on
Apr 1, 1995
Bought by
Vertenten Jeffrey R and Vertenten Lois A
Purchase Details
Closed on
Feb 1, 1993
Bought by
Vertenten Jeffrey R and Vertenten Lois A
Purchase Details
Closed on
Jan 1, 1993
Bought by
Vertenten Jeffrey R and Vertenten Lois A
Purchase Details
Closed on
Oct 1, 1992
Bought by
Vertenten Jeffrey R and Vertenten Lois A
Purchase Details
Closed on
Jun 1, 1992
Bought by
Vertenten Jeffrey R and Vertenten Lois A
Create a Home Valuation Report for This Property
The Home Valuation Report is an in-depth analysis detailing your home's value as well as a comparison with similar homes in the area
Home Values in the Area
Average Home Value in this Area
Purchase History
| Date | Buyer | Sale Price | Title Company |
|---|---|---|---|
| Vertenten Jeffrey R | -- | Attorney | |
| Vertenten Jeffrey R | $200,000 | Manatee Title Co Inc | |
| Vertenten Jeffrey R | $100 | -- | |
| Vertenten Jeffrey R | $100 | -- | |
| Vertenten Jeffrey R | $172,600 | -- | |
| Vertenten Jeffrey R | $172,600 | -- | |
| Vertenten Jeffrey R | $22,600 | -- |
Source: Public Records
Tax History Compared to Growth
Tax History
| Year | Tax Paid | Tax Assessment Tax Assessment Total Assessment is a certain percentage of the fair market value that is determined by local assessors to be the total taxable value of land and additions on the property. | Land | Improvement |
|---|---|---|---|---|
| 2025 | $2,016 | $172,686 | -- | -- |
| 2024 | $1,992 | $167,819 | -- | -- |
| 2023 | $1,992 | $162,931 | $0 | $0 |
| 2022 | $1,864 | $158,185 | $0 | $0 |
| 2021 | $1,788 | $153,578 | $0 | $0 |
| 2020 | $1,727 | $210,980 | $15,300 | $195,680 |
| 2019 | $1,703 | $187,952 | $15,300 | $172,652 |
| 2018 | $1,675 | $162,362 | $12,750 | $149,612 |
| 2017 | $1,667 | $142,304 | $11,480 | $130,824 |
| 2016 | $1,685 | $139,377 | $14,000 | $125,377 |
| 2015 | $1,708 | $138,408 | $20,610 | $117,798 |
| 2014 | $1,819 | $141,754 | $22,213 | $119,541 |
Source: Public Records
Map
Nearby Homes
- 636 N Cherry Pop Dr
- 869 N Kensington Ave
- 700 N Cherry Pop Dr
- 787 E Reehill St
- 1200 N Annapolis Ave
- 751 E Reehill St
- 1323 N Annapolis Ave
- 631 E Liberty St
- 1105 N Mediterranean Way
- 1373 N Hambletonian Dr
- 456 N Spend A Buck Dr
- 1464 N Hambletonian Dr
- 1495 N Man o War Dr
- 350 N Kensington Ave
- 1473 E Saint Charles Place
- 395 N Cherry Pop Ln
- 1302 E Hartford St
- 1037 E Hartford St
- 439 E Reehill St
- 281 N Kensington Ave
- 395 N Cherry Pop Dr
- 864 N Cherry Pop Dr
- 920 N Cherry Pop Dr
- 418 N Cherry Pop Dr
- 855 N Cherry Pop Dr
- 879 N Cherry Pop Dr
- 915 N Cherry Pop Dr
- 840 N Cherry Pop Dr
- 952 N Cherry Pop Dr
- 939 N Cherry Pop Dr
- 901 N Man o War Dr
- 863 N Man o War Dr
- 816 N Cherry Pop Dr
- 978 N Cherry Pop Dr
- 837 N Man o War Dr
- 823 N Cherry Pop Dr
- 961 N Cherry Pop Dr
- 610 N Man o War Dr
- 809 N Man o War Dr
- 784 N Cherry Pop Dr