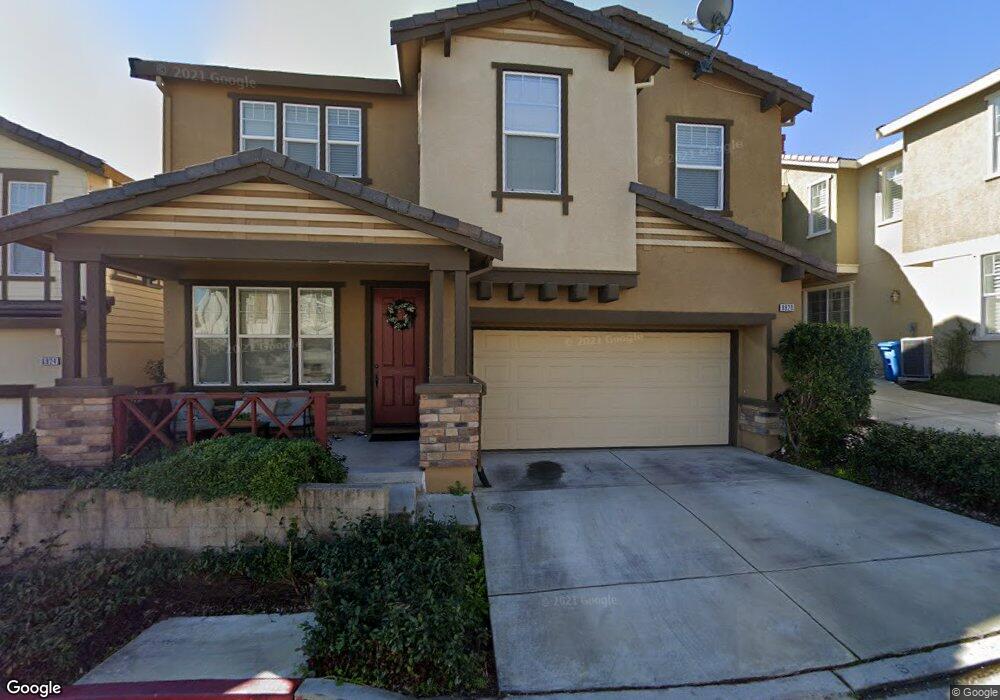
8920 Acorn Way Gilroy, CA 95020
Las Animas NeighborhoodEstimated Value: $1,000,000 - $1,226,000
4
Beds
3
Baths
2,062
Sq Ft
$522/Sq Ft
Est. Value
About This Home
This home is located at 8920 Acorn Way, Gilroy, CA 95020 and is currently estimated at $1,075,509, approximately $521 per square foot. 8920 Acorn Way is a home located in Santa Clara County with nearby schools including Luigi Aprea Elementary School, Brownell Middle School, and Solorsano Middle School.
Ownership History
Date
Name
Owned For
Owner Type
Purchase Details
Closed on
Feb 16, 2009
Sold by
Hsbc Bank Usa National Association
Bought by
Barragan Yolanda and Rodriguez Jonathan
Current Estimated Value
Home Financials for this Owner
Home Financials are based on the most recent Mortgage that was taken out on this home.
Original Mortgage
$421,229
Outstanding Balance
$267,547
Interest Rate
5.19%
Mortgage Type
FHA
Estimated Equity
$807,962
Purchase Details
Closed on
Dec 5, 2008
Sold by
Nino Lorenzo R and Humphrey Sara
Bought by
Hsbc Bank Usa National Association
Purchase Details
Closed on
Jun 18, 2008
Sold by
Humphrey Sara
Bought by
Nino Lorenzo R
Purchase Details
Closed on
Dec 20, 2006
Sold by
Standard Pacific Corp
Bought by
Nino Lorenzo R and Humphrey Sara
Home Financials for this Owner
Home Financials are based on the most recent Mortgage that was taken out on this home.
Original Mortgage
$545,950
Interest Rate
7.12%
Mortgage Type
Purchase Money Mortgage
Create a Home Valuation Report for This Property
The Home Valuation Report is an in-depth analysis detailing your home's value as well as a comparison with similar homes in the area
Home Values in the Area
Average Home Value in this Area
Purchase History
| Date | Buyer | Sale Price | Title Company |
|---|---|---|---|
| Barragan Yolanda | $429,000 | Lawyers Title | |
| Hsbc Bank Usa National Association | $360,000 | None Available | |
| Nino Lorenzo R | -- | None Available | |
| Nino Lorenzo R | $682,500 | Old Republic Title Company |
Source: Public Records
Mortgage History
| Date | Status | Borrower | Loan Amount |
|---|---|---|---|
| Open | Barragan Yolanda | $421,229 | |
| Previous Owner | Nino Lorenzo R | $136,450 | |
| Previous Owner | Nino Lorenzo R | $545,950 |
Source: Public Records
Tax History Compared to Growth
Tax History
| Year | Tax Paid | Tax Assessment Tax Assessment Total Assessment is a certain percentage of the fair market value that is determined by local assessors to be the total taxable value of land and additions on the property. | Land | Improvement |
|---|---|---|---|---|
| 2025 | $6,680 | $552,432 | $220,972 | $331,460 |
| 2024 | $6,680 | $541,601 | $216,640 | $324,961 |
| 2023 | $6,680 | $530,983 | $212,393 | $318,590 |
| 2022 | $6,528 | $520,573 | $208,229 | $312,344 |
| 2021 | $6,497 | $510,367 | $204,147 | $306,220 |
| 2020 | $6,425 | $505,135 | $202,054 | $303,081 |
| 2019 | $6,364 | $495,232 | $198,093 | $297,139 |
| 2018 | $5,942 | $485,522 | $194,209 | $291,313 |
| 2017 | $6,065 | $476,002 | $190,401 | $285,601 |
| 2016 | $5,940 | $466,669 | $186,668 | $280,001 |
| 2015 | $5,604 | $459,661 | $183,865 | $275,796 |
| 2014 | $5,567 | $450,658 | $180,264 | $270,394 |
Source: Public Records
Map
Nearby Homes
- 8940 Acorn Way
- 1482 Goshawk Ct
- 1796 Colony Way
- 1925 Mantelli Dr
- 8745 Wild Iris Dr
- 1920 Mantelli Dr
- 9110 Tea Tree Way
- 9045 Tea Tree Way
- 1620 Welburn Ave
- 1810 Carob Ct
- 9250 Mahogany Ct
- 8341 Winter Green Ct
- 1469 Eagles Nest Ln
- 2302 Hoya Ln
- 1501 Welburn Ave
- 8320 Chantrelle Ct
- 9214 Orinda Way
- 8255 Rancho Real
- 1206 Sycamore Ct
- 2320 Stonecress St
- 8924 Acorn Way
- 8910 Acorn Way
- 1710 Hemlock Ct
- 8930 Acorn Way
- 8944 Acorn Way
- 1711 Hemlock Ct
- 8904 Acorn Way
- 8933 Rancho Hills Dr
- 8963 Rancho Hills Dr
- 8903 Rancho Hills Dr
- 8951 Acorn Way
- 1721 Hemlock Ct
- 8900 Acorn Way
- 8983 Rancho Hills Dr
- 8964 Acorn Way
- 8960 Acorn Way
- 8950 Acorn Way
- 1730 Hemlock Ct
- 8883 Rancho Hills Dr
- 8945 Acorn Way