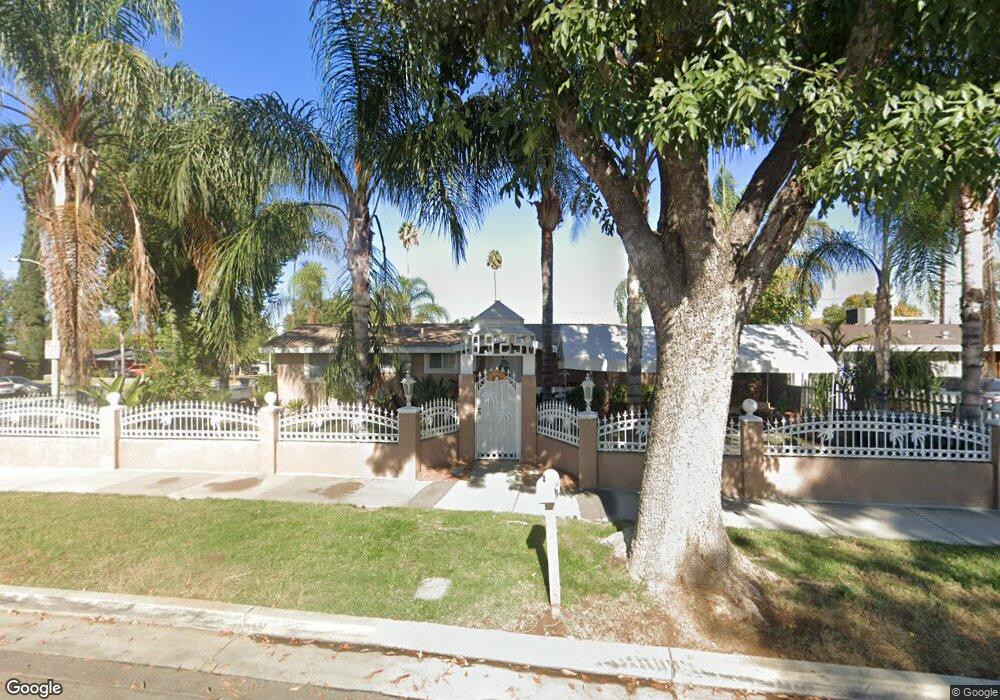
8925 Haskell St Riverside, CA 92503
Presidential Park NeighborhoodEstimated Value: $513,000 - $566,000
3
Beds
2
Baths
1,364
Sq Ft
$398/Sq Ft
Est. Value
About This Home
This home is located at 8925 Haskell St, Riverside, CA 92503 and is currently estimated at $542,604, approximately $397 per square foot. 8925 Haskell St is a home located in Riverside County with nearby schools including Hawthorne Elementary School, Chemawa Middle School, and Arlington High School.
Ownership History
Date
Name
Owned For
Owner Type
Purchase Details
Closed on
Jul 25, 2001
Sold by
Calderon Mario A
Bought by
Calderon Mario A and Calderon Maria G
Current Estimated Value
Home Financials for this Owner
Home Financials are based on the most recent Mortgage that was taken out on this home.
Original Mortgage
$16,394
Outstanding Balance
$6,322
Interest Rate
7.15%
Mortgage Type
Purchase Money Mortgage
Estimated Equity
$536,282
Purchase Details
Closed on
Feb 11, 1999
Sold by
Maria Hagerman
Bought by
Calderon Mario A
Home Financials for this Owner
Home Financials are based on the most recent Mortgage that was taken out on this home.
Original Mortgage
$106,125
Interest Rate
6.7%
Mortgage Type
FHA
Purchase Details
Closed on
Nov 5, 1998
Sold by
Bankatlantic
Bought by
Panacea Investments Corp
Purchase Details
Closed on
Apr 3, 1998
Sold by
Hagerman Lowell E and Hagerman Maria I
Bought by
Bankatlantic
Create a Home Valuation Report for This Property
The Home Valuation Report is an in-depth analysis detailing your home's value as well as a comparison with similar homes in the area
Home Values in the Area
Average Home Value in this Area
Purchase History
| Date | Buyer | Sale Price | Title Company |
|---|---|---|---|
| Calderon Mario A | -- | -- | |
| Calderon Mario A | -- | Old Republic Title Company | |
| Calderon Mario A | $107,000 | Old Republic Title Company | |
| Panacea Investments Corp | $62,000 | American Title | |
| Bankatlantic | $86,000 | Stewart Title |
Source: Public Records
Mortgage History
| Date | Status | Borrower | Loan Amount |
|---|---|---|---|
| Open | Calderon Mario A | $16,394 | |
| Previous Owner | Calderon Mario A | $106,125 |
Source: Public Records
Tax History
| Year | Tax Paid | Tax Assessment Tax Assessment Total Assessment is a certain percentage of the fair market value that is determined by local assessors to be the total taxable value of land and additions on the property. | Land | Improvement |
|---|---|---|---|---|
| 2025 | $1,866 | $167,709 | $62,688 | $105,021 |
| 2023 | $1,866 | $161,198 | $60,254 | $100,944 |
| 2022 | $1,824 | $158,038 | $59,073 | $98,965 |
| 2021 | $1,813 | $154,940 | $57,915 | $97,025 |
| 2020 | $1,799 | $153,353 | $57,322 | $96,031 |
| 2019 | $1,766 | $150,348 | $56,199 | $94,149 |
| 2018 | $1,733 | $147,401 | $55,099 | $92,302 |
| 2017 | $1,703 | $144,512 | $54,019 | $90,493 |
| 2016 | $1,597 | $141,679 | $52,960 | $88,719 |
| 2015 | $1,574 | $139,553 | $52,165 | $87,388 |
| 2014 | $1,559 | $136,822 | $51,145 | $85,677 |
Source: Public Records
Map
Nearby Homes
- 8864 Haskell St
- 0 Jackson St
- 3306 Brou Ln
- 3048 Strassbourg Dr
- 3190 Madrone Ln
- 9179 Teralina Cir
- 9170 Teralina Cir
- 9175 Teralina Cir
- 9183 Teralina Cir
- 3192 Arvoredo Ln
- 9187 Waverly Ln
- 9191 Waverly Ln
- 9195 Waverly Ln
- 9194 Connolly Ln
- 9198 Connolly Ln
- 9187 Connolly Ln
- 9186 Connolly Ln
- 9190 Connolly Ln
- 9195 Connolly Ln
- 9191 Connolly Ln
- 8919 Haskell St
- 8898 Shawnee St
- 8907 Haskell St
- 8933 Haskell St
- 8890 Shawnee St
- 8923 Shawnee St
- 8916 Haskell St
- 8920 Haskell St
- 8883 Marlene St
- 8911 Shawnee St
- 8901 Haskell St
- 8912 Haskell St
- 8926 Haskell St
- 8882 Shawnee St
- 8871 Marlene St
- 8901 Shawnee St
- 8932 Amber St
- 8938 Amber St
- 8932 Haskell St
- 8926 Amber St
Your Personal Tour Guide
Ask me questions while you tour the home.