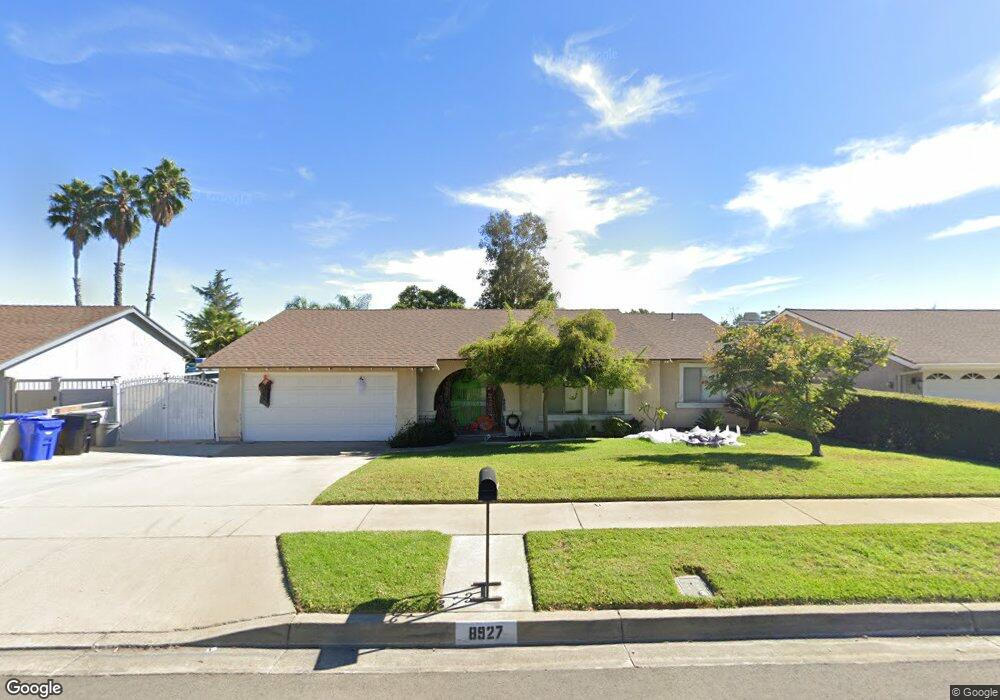
8927 Hemlock St Rancho Cucamonga, CA 91730
Estimated Value: $655,000 - $722,000
3
Beds
2
Baths
1,244
Sq Ft
$564/Sq Ft
Est. Value
About This Home
This home is located at 8927 Hemlock St, Rancho Cucamonga, CA 91730 and is currently estimated at $701,202, approximately $563 per square foot. 8927 Hemlock St is a home located in San Bernardino County with nearby schools including Valle Vista Elementary, Cucamonga Middle, and Alta Loma High.
Ownership History
Date
Name
Owned For
Owner Type
Purchase Details
Closed on
Dec 10, 2013
Sold by
Olivas Eric
Bought by
Olivas Brenda
Current Estimated Value
Purchase Details
Closed on
Jul 19, 2010
Sold by
Olivas Eric
Bought by
Olivas Eric and Olivas Brenda Morales
Home Financials for this Owner
Home Financials are based on the most recent Mortgage that was taken out on this home.
Original Mortgage
$342,543
Outstanding Balance
$227,965
Interest Rate
4.75%
Mortgage Type
FHA
Estimated Equity
$473,237
Purchase Details
Closed on
Feb 1, 2008
Sold by
Fahrenkamp David
Bought by
Olivas Eric and Morales Brenda
Home Financials for this Owner
Home Financials are based on the most recent Mortgage that was taken out on this home.
Original Mortgage
$344,592
Interest Rate
5.64%
Mortgage Type
FHA
Purchase Details
Closed on
Sep 21, 1995
Sold by
Fahrenkamp David J
Bought by
Fahrenkamp David and Fahrenkamp Jerry
Create a Home Valuation Report for This Property
The Home Valuation Report is an in-depth analysis detailing your home's value as well as a comparison with similar homes in the area
Home Values in the Area
Average Home Value in this Area
Purchase History
| Date | Buyer | Sale Price | Title Company |
|---|---|---|---|
| Olivas Brenda | -- | None Available | |
| Olivas Eric | -- | Security Union Title Insuran | |
| Olivas Eric | $350,000 | Landwood Title | |
| Fahrenkamp David | -- | -- |
Source: Public Records
Mortgage History
| Date | Status | Borrower | Loan Amount |
|---|---|---|---|
| Open | Olivas Eric | $342,543 | |
| Closed | Olivas Eric | $344,592 |
Source: Public Records
Tax History Compared to Growth
Tax History
| Year | Tax Paid | Tax Assessment Tax Assessment Total Assessment is a certain percentage of the fair market value that is determined by local assessors to be the total taxable value of land and additions on the property. | Land | Improvement |
|---|---|---|---|---|
| 2025 | $4,996 | $459,734 | $174,699 | $285,035 |
| 2024 | $4,996 | $450,720 | $171,274 | $279,446 |
| 2023 | $4,887 | $441,883 | $167,916 | $273,967 |
| 2022 | $4,809 | $433,219 | $164,624 | $268,595 |
| 2021 | $4,809 | $424,724 | $161,396 | $263,328 |
| 2020 | $4,672 | $420,369 | $159,741 | $260,628 |
| 2019 | $4,649 | $412,127 | $156,609 | $255,518 |
| 2018 | $4,519 | $404,046 | $153,538 | $250,508 |
| 2017 | $4,438 | $396,123 | $150,527 | $245,596 |
| 2016 | $4,386 | $388,355 | $147,575 | $240,780 |
| 2015 | $4,339 | $382,521 | $145,358 | $237,163 |
| 2014 | $3,425 | $304,000 | $106,000 | $198,000 |
Source: Public Records
Map
Nearby Homes
- 7719 Vineyard Ave
- 7906 Montara Ave
- 0 Camino Predera Unit OC25188933
- 0 Camino Predera Unit WS25184133
- 8091 Camino Predera
- 8167 Vineyard Ave Unit 23
- 8167 Vineyard Ave Unit 38
- 8167 Vineyard Ave Unit 109
- 8976 Yew St
- 9340 Foothill Blvd Unit 68
- 9340 Foothill Blvd Unit 61
- 9340 Foothill Blvd
- 8651 Foothill Blvd Unit 63
- 8651 Foothill Blvd Unit 18
- 8651 Foothill Blvd Unit 46
- 8651 Foothill Blvd Unit 99
- 8651 Foothill Blvd Unit 42
- 7730 Layton St
- 8321 Vineyard Ave Unit 5
- 8305 Highridge Place
- 8917 Hemlock St
- 8937 Hemlock St
- 7923 Summerlin Place
- 9007 Chianti Ct
- 8907 Hemlock St
- 8951 Hemlock St
- 8926 Hemlock St
- 8938 Hemlock St
- 8916 Hemlock St
- 9010 Chardonnay Cir
- 7922 Summerlin Place
- 9017 Chianti Ct
- 8897 Hemlock St
- 9012 Chianti Ct
- 7927 Summerlin Place
- 8961 Hemlock St
- 8906 Hemlock St
- 8950 Hemlock St
- 9027 Chianti Ct
- 7835 Hickory Cir