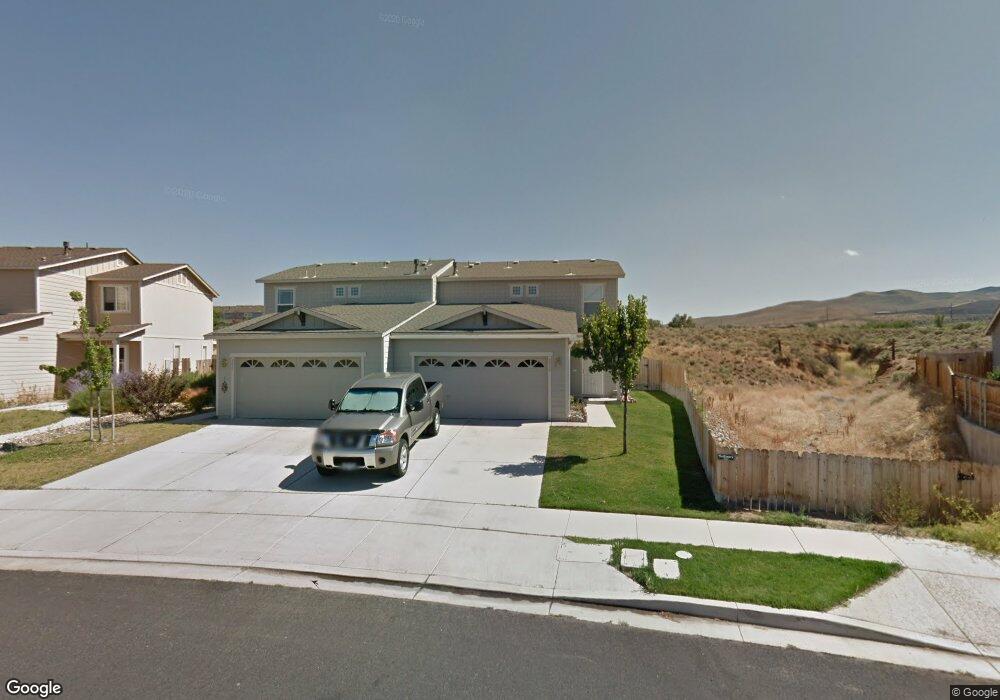
8928 Red Baron Blvd Reno, NV 89506
Stead NeighborhoodEstimated Value: $383,000 - $424,000
3
Beds
3
Baths
1,350
Sq Ft
$295/Sq Ft
Est. Value
About This Home
This home is located at 8928 Red Baron Blvd, Reno, NV 89506 and is currently estimated at $397,751, approximately $294 per square foot. 8928 Red Baron Blvd is a home located in Washoe County with nearby schools including Stokesdale Elementary School, Silver Lake Elementary School, and Glenn C. Marlow Elementary School.
Ownership History
Date
Name
Owned For
Owner Type
Purchase Details
Closed on
Jun 4, 2021
Sold by
Sjogren Heidi K
Bought by
Sjogren Heidi
Current Estimated Value
Home Financials for this Owner
Home Financials are based on the most recent Mortgage that was taken out on this home.
Original Mortgage
$201,000
Outstanding Balance
$180,787
Interest Rate
2.9%
Mortgage Type
New Conventional
Estimated Equity
$216,964
Purchase Details
Closed on
May 5, 2005
Sold by
Centex Homes
Bought by
Sjogren Heidi K
Home Financials for this Owner
Home Financials are based on the most recent Mortgage that was taken out on this home.
Original Mortgage
$160,750
Interest Rate
5.87%
Mortgage Type
Fannie Mae Freddie Mac
Create a Home Valuation Report for This Property
The Home Valuation Report is an in-depth analysis detailing your home's value as well as a comparison with similar homes in the area
Home Values in the Area
Average Home Value in this Area
Purchase History
| Date | Buyer | Sale Price | Title Company |
|---|---|---|---|
| Sjogren Heidi | -- | True Title & Escrow | |
| Sjogren Heidi K | $201,000 | Commerce Title Company |
Source: Public Records
Mortgage History
| Date | Status | Borrower | Loan Amount |
|---|---|---|---|
| Open | Sjogren Heidi | $201,000 | |
| Closed | Sjogren Heidi K | $160,750 | |
| Closed | Sjogren Heidi K | $40,150 |
Source: Public Records
Tax History Compared to Growth
Tax History
| Year | Tax Paid | Tax Assessment Tax Assessment Total Assessment is a certain percentage of the fair market value that is determined by local assessors to be the total taxable value of land and additions on the property. | Land | Improvement |
|---|---|---|---|---|
| 2026 | $1,027 | $75,374 | $26,250 | $49,124 |
| 2025 | $1,319 | $75,894 | $26,600 | $49,294 |
| 2024 | $1,319 | $73,940 | $22,960 | $50,980 |
| 2023 | $1,281 | $69,750 | $24,885 | $44,865 |
| 2022 | $1,245 | $59,281 | $20,545 | $38,736 |
| 2021 | $1,208 | $54,826 | $16,065 | $38,761 |
| 2020 | $1,172 | $55,401 | $16,450 | $38,951 |
| 2019 | $1,138 | $53,904 | $15,890 | $38,014 |
| 2018 | $1,105 | $47,838 | $10,640 | $37,198 |
| 2017 | $1,074 | $47,088 | $10,185 | $36,903 |
| 2016 | $1,046 | $46,133 | $8,715 | $37,418 |
| 2015 | $1,044 | $46,012 | $7,875 | $38,137 |
| 2014 | $1,014 | $33,867 | $5,145 | $28,722 |
| 2013 | -- | $26,976 | $4,095 | $22,881 |
Source: Public Records
Map
Nearby Homes
- 8660 Sunrise Mist Ct
- 8678 Strutter Way
- 8602 Strutter Way
- 8696 Red Baron Blvd
- 7456 Creekland Dr
- 7497 Hebrides Ct
- 7447 Findhorn Dr
- 7462 Findhorn Dr
- 7663 Crystal Shores Dr
- 8486 Piper Place
- 8410 Red Baron Blvd
- 7085 Indigo Cir
- 8419 Sopwith Blvd
- 11642 Green Mountain St
- 6995 Peppermint Dr
- 6769 Peppermint Ct
- 6521 Flower St
- 12123 Andes St
- 8031 Monterey Shores Dr
- 6760 Honeysuckle Ct
- 8932 Red Baron Blvd
- 8936 Red Baron Blvd
- 8920 Red Baron Blvd
- 8620 Sunrise Mist Ct
- 8940 Red Baron Blvd
- 8916 Red Baron Blvd
- 8944 Red Baron Blvd
- 8912 Red Baron Blvd
- 8630 Sunrise Mist Ct
- 8907 Red Baron Blvd
- 8908 Red Baron Blvd
- 8948 Red Baron Blvd
- 8903 Red Baron Blvd
- 8911 Red Baron Blvd
- 8640 Sunrise Mist Ct
- 8915 Red Baron Blvd
- 8790 Sunset Breeze Dr
- 8794 Sunset Breeze Dr
- 8782 Sunset Breeze Dr
- 8810 Sunset Breeze Dr