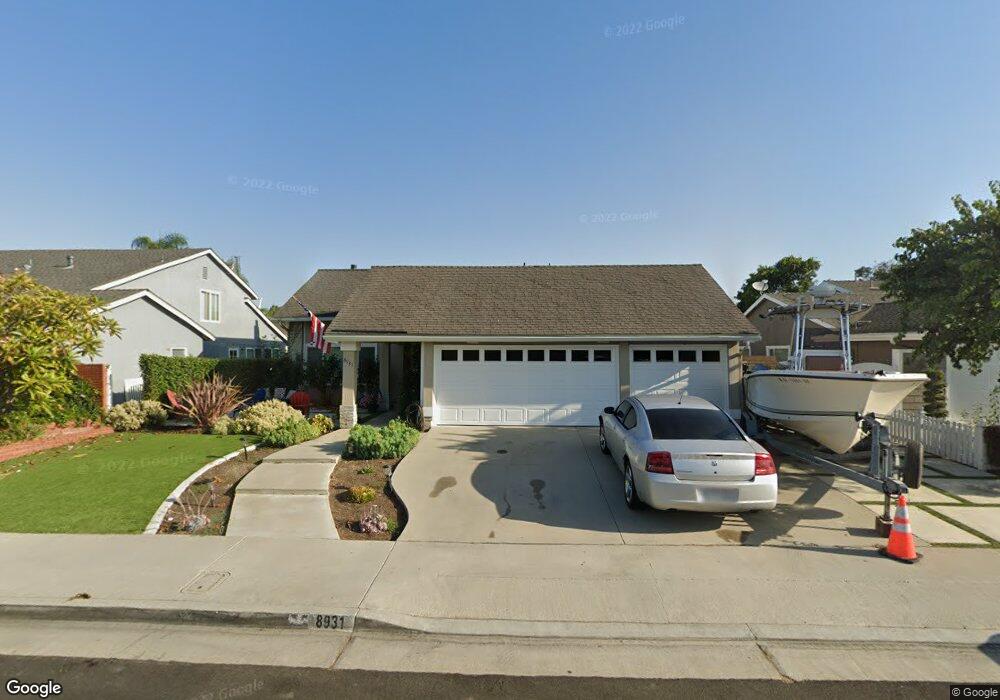
8931 Henton Dr Huntington Beach, CA 92646
Southeast NeighborhoodEstimated Value: $1,564,090 - $1,699,000
5
Beds
3
Baths
2,215
Sq Ft
$751/Sq Ft
Est. Value
About This Home
This home is located at 8931 Henton Dr, Huntington Beach, CA 92646 and is currently estimated at $1,662,523, approximately $750 per square foot. 8931 Henton Dr is a home located in Orange County with nearby schools including S.A. Moffett Elementary School, Isaac L. Sowers Middle School, and Edison High School.
Ownership History
Date
Name
Owned For
Owner Type
Purchase Details
Closed on
Aug 22, 2018
Sold by
Hill Christopehr Stephen
Bought by
Hill Christopher Stephen and The Christopher Hill Separate Property
Current Estimated Value
Purchase Details
Closed on
Dec 6, 2017
Sold by
Keeland Deann Lynn
Bought by
Hill Christopher Stephen
Purchase Details
Closed on
Jun 9, 2008
Sold by
Hill Stephen A
Bought by
Hill Stephen A and Hill Family Revocable Living Trust
Purchase Details
Closed on
Mar 31, 2003
Sold by
Hill Stephen A and Hill Karen L
Bought by
Hill Stephen A and Hill Karen L
Purchase Details
Closed on
Oct 24, 2001
Sold by
Sherburne Fred S
Bought by
Hill Stephen A and Hill Karen L
Purchase Details
Closed on
Jul 15, 1999
Sold by
Security Trust Company
Bought by
Hill Stephen Arthur and Hill Karen Louise
Purchase Details
Closed on
Jan 6, 1999
Sold by
Sherburne Fred Sam and Sherburne Alveria Pearl
Bought by
Sherburne Fred S and Sherburne Alveria P
Purchase Details
Closed on
Nov 15, 1985
Sold by
Arthur Hill Stephen and Arthur Louise Karen
Bought by
Sherburne Fred Sam and Sherburne Alveria Pearl
Create a Home Valuation Report for This Property
The Home Valuation Report is an in-depth analysis detailing your home's value as well as a comparison with similar homes in the area
Home Values in the Area
Average Home Value in this Area
Purchase History
| Date | Buyer | Sale Price | Title Company |
|---|---|---|---|
| Hill Christopher Stephen | -- | None Available | |
| Hill Christopher Stephen | -- | None Available | |
| Hill Stephen A | -- | None Available | |
| Hill Stephen A | -- | -- | |
| Hill Stephen A | -- | -- | |
| Hill Stephen Arthur | -- | Chicago Title Co | |
| Sherburne Fred S | -- | -- | |
| Sherburne Fred Sam | -- | -- |
Source: Public Records
Tax History Compared to Growth
Tax History
| Year | Tax Paid | Tax Assessment Tax Assessment Total Assessment is a certain percentage of the fair market value that is determined by local assessors to be the total taxable value of land and additions on the property. | Land | Improvement |
|---|---|---|---|---|
| 2025 | $4,497 | $379,739 | $160,163 | $219,576 |
| 2024 | $4,497 | $372,294 | $157,023 | $215,271 |
| 2023 | $4,394 | $364,995 | $153,945 | $211,050 |
| 2022 | $4,278 | $357,839 | $150,927 | $206,912 |
| 2021 | $4,200 | $350,823 | $147,968 | $202,855 |
| 2020 | $4,172 | $347,226 | $146,451 | $200,775 |
| 2019 | $4,125 | $340,418 | $143,579 | $196,839 |
| 2018 | $4,062 | $333,744 | $140,764 | $192,980 |
| 2017 | $4,008 | $327,200 | $138,003 | $189,197 |
| 2016 | $3,760 | $320,785 | $135,297 | $185,488 |
| 2015 | $3,722 | $315,967 | $133,265 | $182,702 |
| 2014 | $3,643 | $309,778 | $130,654 | $179,124 |
Source: Public Records
Map
Nearby Homes
- 20258 Lantana Dr
- 20131 Crown Reef Ln
- 8886 Plumas Cir Unit 1124-A
- 20191 Imperial Cove Ln
- 20111 Marina Ln
- 8932 Amador Cir Unit 1309B
- 8856 Sutter Cir Unit 522A
- 8856 526C Sutter
- 8646 Butte Cir Unit 607E
- 20071 Moontide Cir
- 8565 Trinity Cir Unit 824D
- 8472 Norfolk Dr
- 20251 Lighthouse Ln
- 9522 Yellowstone Dr
- 8565 Colusa Cir Unit 906C
- 9001 Oceanwood Dr
- 8565 Larkhall Cir Unit 804A
- 8342 Seaport Dr
- 8566 Larkhall Cir Unit 808A
- 8566 Larkhall Cir Unit 809D
- 8921 Henton Dr
- 8951 Henton Dr
- 8932 Burlcrest Dr
- 8922 Burlcrest Dr
- 8901 Henton Dr
- 8952 Burlcrest Dr
- 8961 Henton Dr
- 8932 Henton Dr
- 8902 Burlcrest Dr
- 8922 Henton Dr
- 8952 Henton Dr
- 8891 Henton Dr
- 8902 Henton Dr
- 20242 Swansea Ln
- 8962 Henton Dr
- 8892 Burlcrest Dr
- 8881 Henton Dr
- 8931 Burlcrest Dr
- 8931 Bedel Dr
- 20232 Swansea Ln