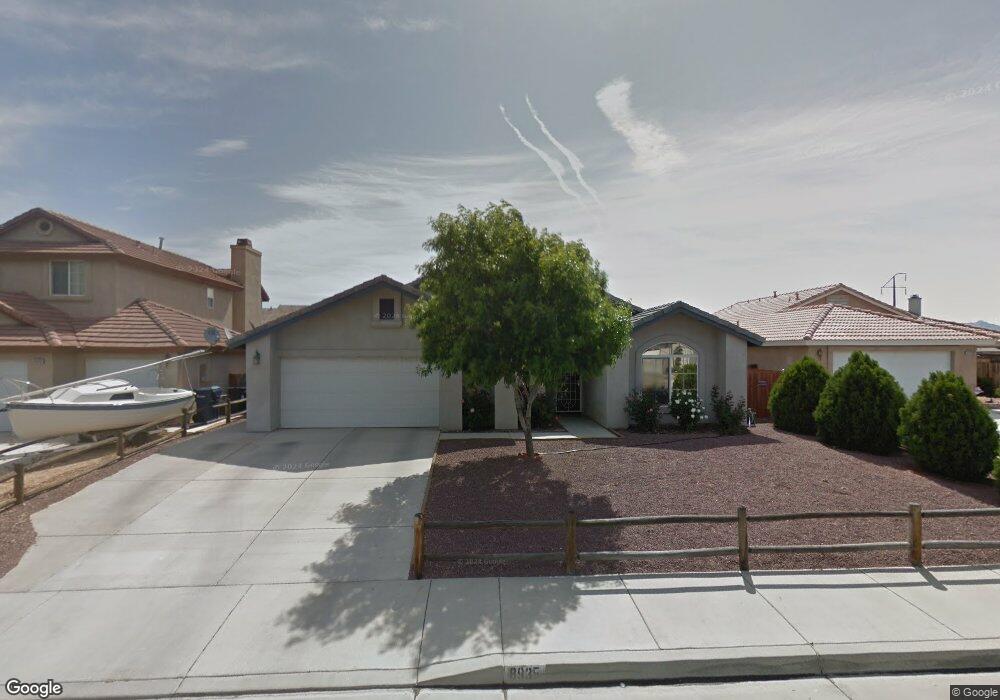
8935 Fallbrook Ct Hesperia, CA 92344
High Country NeighborhoodEstimated Value: $481,601 - $511,000
4
Beds
3
Baths
2,252
Sq Ft
$219/Sq Ft
Est. Value
About This Home
This home is located at 8935 Fallbrook Ct, Hesperia, CA 92344 and is currently estimated at $493,150, approximately $218 per square foot. 8935 Fallbrook Ct is a home located in San Bernardino County with nearby schools including Cottonwood Elementary School, Cedar Middle School, and Oak Hills High School.
Ownership History
Date
Name
Owned For
Owner Type
Purchase Details
Closed on
Jan 24, 2022
Sold by
Cruz Family Trust
Bought by
Cruz Family Trust
Current Estimated Value
Home Financials for this Owner
Home Financials are based on the most recent Mortgage that was taken out on this home.
Original Mortgage
$200,000
Interest Rate
3.45%
Mortgage Type
New Conventional
Purchase Details
Closed on
Nov 22, 2016
Sold by
Cruz Armando and Cruz Sherri
Bought by
Cruz Armando and Cruz Sherri
Purchase Details
Closed on
Nov 29, 2013
Sold by
Cruz Armando C
Bought by
Cruz Armando C and Cruz Sherri A
Purchase Details
Closed on
Mar 12, 2002
Sold by
Hesperia Maple Street Development Lp
Bought by
Cruz Armando C
Home Financials for this Owner
Home Financials are based on the most recent Mortgage that was taken out on this home.
Original Mortgage
$157,548
Interest Rate
8.5%
Create a Home Valuation Report for This Property
The Home Valuation Report is an in-depth analysis detailing your home's value as well as a comparison with similar homes in the area
Home Values in the Area
Average Home Value in this Area
Purchase History
| Date | Buyer | Sale Price | Title Company |
|---|---|---|---|
| Cruz Family Trust | -- | Rosenberg Lpa Llc | |
| Cruz Armando | -- | None Available | |
| Cruz Armando C | -- | None Available | |
| Cruz Armando C | $166,000 | Lawyers Title Company |
Source: Public Records
Mortgage History
| Date | Status | Borrower | Loan Amount |
|---|---|---|---|
| Closed | Cruz Family Trust | $200,000 | |
| Previous Owner | Cruz Armando C | $157,548 |
Source: Public Records
Tax History Compared to Growth
Tax History
| Year | Tax Paid | Tax Assessment Tax Assessment Total Assessment is a certain percentage of the fair market value that is determined by local assessors to be the total taxable value of land and additions on the property. | Land | Improvement |
|---|---|---|---|---|
| 2025 | $2,712 | $244,999 | $59,093 | $185,906 |
| 2024 | $2,712 | $240,195 | $57,934 | $182,261 |
| 2023 | $2,682 | $235,485 | $56,798 | $178,687 |
| 2022 | $2,621 | $230,867 | $55,684 | $175,183 |
| 2021 | $2,573 | $226,340 | $54,592 | $171,748 |
| 2020 | $2,544 | $224,019 | $54,032 | $169,987 |
| 2019 | $2,492 | $219,627 | $52,973 | $166,654 |
| 2018 | $2,444 | $215,320 | $51,934 | $163,386 |
| 2017 | $2,401 | $211,098 | $50,916 | $160,182 |
| 2016 | $2,351 | $206,959 | $49,918 | $157,041 |
| 2015 | $2,321 | $203,850 | $49,168 | $154,682 |
| 2014 | $2,165 | $182,900 | $36,800 | $146,100 |
Source: Public Records
Map
Nearby Homes
- 14122 Hartford St
- 14110 Hartford St
- 8843 Newcastle Ave
- Agate Plan at Seasons at Topaz
- 8800 Newcastle Ave
- 14191 Hartford St
- 8863 Glencliff Ave
- Ammolite HX Plan at Seasons at Topaz
- 14415 Hartford St
- 14145 Hartford St
- 8792 Newcastle Ave
- 8846 Tamarisk Ave
- 14148 Hartford St
- 0 Tamarisk Ave Unit HD23052637
- 9143 Ocotillo Ave
- 14131 Desert Rose St
- 8756 Oakwood Ave
- 14572 Sultana St
- 8698 Oakwood Ave
- 14073 Ruby St
- 8943 Fallbrook Ct
- 8929 Fallbrook Ct
- 8938 Glenwood Ave
- 8951 Fallbrook Ct
- 8946 Glenwood Ave
- 8925 Fallbrook Ct
- 8956 Glenwood Ave
- 8936 Fallbrook Ct
- 8924 Glenwood Ave
- 8944 Fallbrook Ct
- 8930 Fallbrook Ct
- 8961 Fallbrook Ct
- 8913 Fallbrook Ct
- 8952 Fallbrook Ct
- 8960 Glenwood Ave
- 8912 Fallbrook Ct
- 8922 Fallbrook Ct
- 8910 Glenwood Ave
- 8962 Fallbrook Ct
- 8937 Hanford Ave