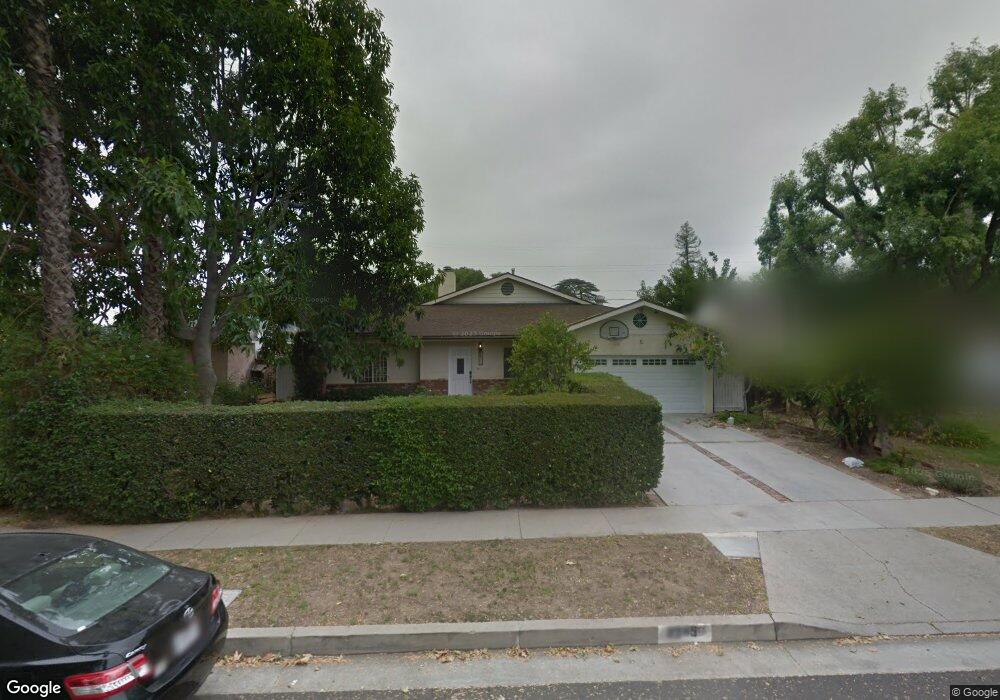
8945 Rathburn Ave Northridge, CA 91325
Estimated Value: $908,000 - $1,202,000
3
Beds
2
Baths
2,108
Sq Ft
$496/Sq Ft
Est. Value
About This Home
This home is located at 8945 Rathburn Ave, Northridge, CA 91325 and is currently estimated at $1,045,234, approximately $495 per square foot. 8945 Rathburn Ave is a home located in Los Angeles County with nearby schools including Northridge Middle School, Northridge Academy High, and Valley Academy of Arts & Sciences.
Ownership History
Date
Name
Owned For
Owner Type
Purchase Details
Closed on
Sep 1, 2016
Sold by
Shtrikman Yevgeniy
Bought by
Shtrikman Yevgeniy and Stepanets Irina
Current Estimated Value
Purchase Details
Closed on
Mar 2, 2012
Sold by
Stepanets Irina
Bought by
Shtrikman Yevgeniy and Stepanets Irina
Home Financials for this Owner
Home Financials are based on the most recent Mortgage that was taken out on this home.
Original Mortgage
$269,000
Outstanding Balance
$34,354
Interest Rate
3.83%
Mortgage Type
New Conventional
Estimated Equity
$1,010,880
Purchase Details
Closed on
Jun 10, 2002
Sold by
Massachi Pari Kalimeh
Bought by
Shtrikman Yevgeniy
Home Financials for this Owner
Home Financials are based on the most recent Mortgage that was taken out on this home.
Original Mortgage
$300,700
Interest Rate
6.78%
Purchase Details
Closed on
Aug 19, 1996
Sold by
Massachi Simon S and Massachi Pari
Bought by
Massachi Pari Kalimeh
Create a Home Valuation Report for This Property
The Home Valuation Report is an in-depth analysis detailing your home's value as well as a comparison with similar homes in the area
Home Values in the Area
Average Home Value in this Area
Purchase History
| Date | Buyer | Sale Price | Title Company |
|---|---|---|---|
| Shtrikman Yevgeniy | -- | None Available | |
| Shtrikman Yevgeniy | -- | Accommodation | |
| Stephanets Irina | -- | Ticor Title Co | |
| Shtrikman Yevgeniy | $340,000 | Landsafe Title | |
| Massachi Pari Kalimeh | -- | -- |
Source: Public Records
Mortgage History
| Date | Status | Borrower | Loan Amount |
|---|---|---|---|
| Open | Stephanets Irina | $269,000 | |
| Closed | Shtrikman Yevgeniy | $300,700 |
Source: Public Records
Tax History Compared to Growth
Tax History
| Year | Tax Paid | Tax Assessment Tax Assessment Total Assessment is a certain percentage of the fair market value that is determined by local assessors to be the total taxable value of land and additions on the property. | Land | Improvement |
|---|---|---|---|---|
| 2025 | $6,049 | $492,414 | $284,009 | $208,405 |
| 2024 | $6,049 | $482,760 | $278,441 | $204,319 |
| 2023 | $5,934 | $473,295 | $272,982 | $200,313 |
| 2022 | $5,662 | $464,016 | $267,630 | $196,386 |
| 2021 | $5,583 | $454,919 | $262,383 | $192,536 |
| 2019 | $5,417 | $441,427 | $254,601 | $186,826 |
| 2018 | $5,316 | $432,772 | $249,609 | $183,163 |
| 2016 | $5,062 | $415,968 | $239,917 | $176,051 |
| 2015 | $4,988 | $409,721 | $236,314 | $173,407 |
| 2014 | $5,010 | $401,696 | $231,685 | $170,011 |
Source: Public Records
Map
Nearby Homes
- 18219 Rayen St
- 18308 Gresham St
- 8741 Darby Ave Unit 16
- 8945 Baird Ave
- 8954 Chimineas Ave
- 18154 Gresham St
- 18041 Acre St
- 9301 Darby Ave
- 18540 Prairie St
- 18729 Sunburst St
- 18356 Napa St
- 18544 Bryant St
- 8939 Rhea Ave
- 8944 Enfield Ave
- 18645 Knapp St
- 8900 Geyser Ave
- 18557 Napa St
- 8921 Geyser Ave
- 18311 Chase St
- 18022 Raymer St
- 8941 Rathburn Ave
- 8951 Rathburn Ave
- 8935 Rathburn Ave
- 8957 Rathburn Ave
- 8944 Darby Ave
- 8938 Darby Ave
- 8950 Darby Ave
- 8929 Rathburn Ave
- 8932 Darby Ave
- 8956 Darby Ave
- 8944 Rathburn Ave
- 9001 Rathburn Ave
- 8950 Rathburn Ave
- 8940 Rathburn Ave
- 8926 Darby Ave
- 8934 Rathburn Ave
- 8956 Rathburn Ave
- 9000 Darby Ave
- 8923 Rathburn Ave
- 9005 Rathburn Ave